Retail sales reports favors kiwi

NZD/USD extends its rally to hit the highest levels since December 2018, as the bulls rejoice a big beat on New Zealand’s Retail Sales data. The NZ retail consumer spending jumped by 28% QoQ in Q3 vs. 20% expected. Meanwhile, successful vaccine trials – led risk-on mood also adds to the strength in the Kiwi.

Domestic data on retail sales blew past all expectations, quashing the risk of further policy easing and underlining the currency’s yield attraction. The gains came as data showed real retail sales in New Zealand boomed by a record 28% in the third quarter, recovering strongly from an historic 14.6% drop the previous quarter when a strict corona virus lockdown crippled consumption. That was far above market expectations and suggested upside risk to the gross domestic product (GDP) report for the third quarter due next month.

“Today’s result is another tick in that column, highlighting the resilience in household spending appetites,” said Satish Ranchhod, a senior economist at Westpac. “This also highlights the effectiveness in monetary and fiscal stimulus in supporting demand through what has been a trying time for the economy.”

New Zealand’s better than expected economic recovery thus far in 2020 has left the RBNZ struggling to justify threats to take rates negative in 2021, hence markets priced this out last week. This is a theme that likely continues to work in NZD/USD’s favour, given the increasingly dovish tone of the FOMC last week on the near-term outlook for the US economy increasing the chance of some central bank divergence over the coming months.

Moreover, with the incoming Biden administration already signalling intent to create a more stable, favourable global trade environment, export-dependent New Zealand is likely to be one of the main beneficiaries of this. These better global trading conditions are still some way off; the world needs to wait for Biden to arrive in office in January and recover from Covid-19 pandemic. But the latter half of 2021 ought to be a good year for the kiwi.

NZD/USD 4 Hour Chart:

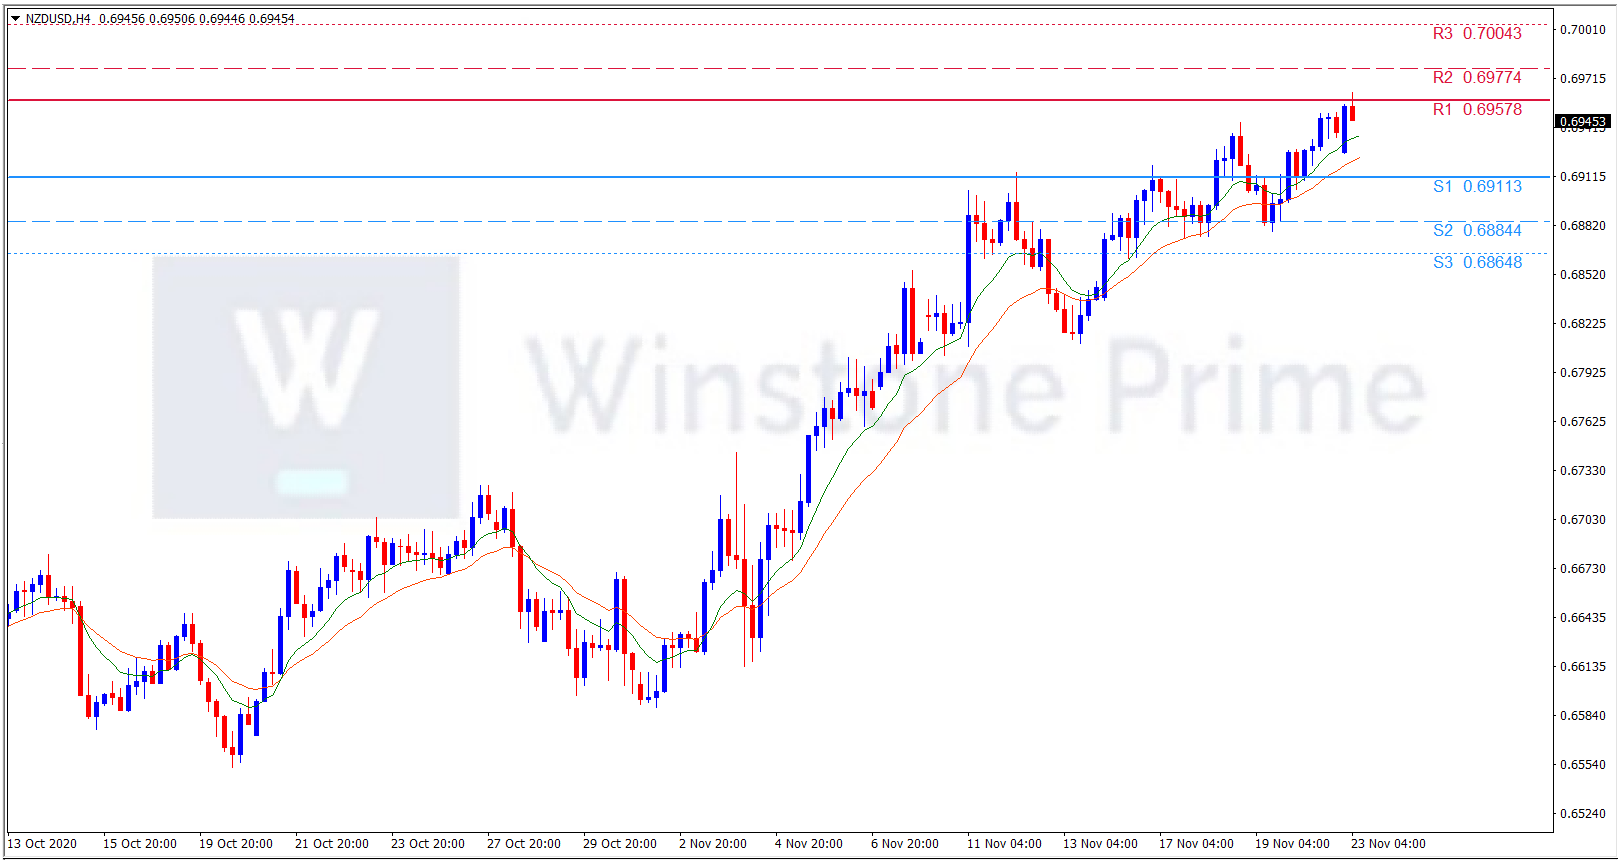
Support: 0.6911 (S1), 0.6884 (S2), 0.6865 (S3).

Resistance: 0.6958 (R1), 0.6977 (R2), 0.7004 (R3).

All the catalysts favors New Zealand dollar against US Dollar, we expect a bullish trend for NZD/USD.

AUD/USD Weekly Forecast (23rd November 2020 – 27th November 2020)

Fundamental view:

Aussie showed a mixed trend for the past week. A tough lockdown was imposed in South Australia, although it was lifted sooner than expected after contact tracers found out that one infected person deliberately lied about his exposure and contact with others. South Australia state Premier Steven Marshall explained the situation in a press conference, indicating that such lies made authorities believe they were facing a highly contagious strain.

NAHB Housing Market Index on 17th November and US TIC Long-Term Purchases on 18th November favored a bearish trend for the pair whereas Australia Employment Change & Unemployment Rate on 19th November and US Natural Gas Storage on 19th November favored bullish trend for the pair.

The major economic events deciding the movement of the pair in the next week are US Markit Manufacturing PMI at Nov 23, US CB Consumer Confidence Index at Nov 24, Australia Construction Work Done quarterly report, US GDP quarterly report, US Core Durable Goods Orders monthly report, US Initial Jobless Claims, FOMC Minutes at Nov 25, and Australia Private New Capital Expenditure quarterly report at Nov 26.

AUD/USD Weekly outlook:

Technical View:

Last week’s high was same as the previous week. Maintaining high at 0.7340 and low at 0.7254 showed a movement of 86 pips.

In the upcoming week we expect AUD/USD to show a bullish trend.  The currency pair is trading above the 200 Simple Moving Average and the MACD trades to the upside. A solid breakout above 0.7346 may open a clean path towards 0.7385 and may take a way up to 0.7431. Should 0.7261 prove to be unreliable support, the AUDUSD may sink downwards 0.7215 and 0.7175 respectively. In H4 chart bullish gartley pattern formation favors prospects of a bullish trend. Also to be noted Bullish engulfing formation exerts the expectation of uptrend for the pair.

Preference
Buy:  0.7301 target at 0.7384 and stop loss at 0.7256


Alternate Scenario
Sell: 0.7256 target at 0.7176 and stop loss at 0.7301

XAU/USD Weekly Forecast (23rd November 2020 – 27th November 2020)

Fundamental view:

Gold markets have pulled back during the course of the week The upbeat Industrial Production and Retail Sales data from China revived hopes for a steady global economic recovery and provided a boost to market sentiment at the start of the week. Additionally, Moderna announced that its coronavirus vaccine candidate was 94.5% effective in the latest trials and noted that it will be seeking authorization for emergency use of the vaccine in the US in the coming weeks.

In the second half of the week, the disappointing Initial Jobless Claims and Retail Sales data from the US caused the market mood to sour and allowed XAU/USD to limit its losses. Additionally, the number of confirmed COVID-19 infections in the US hit a new daily high of 185,000 on Thursday and reminded investors of the potential damage on the economic recovery before a vaccine becomes widely available.

The major economic events deciding the movement of the pair in the next week are Markit Manufacturing PMI at Nov 23, CB Consumer Confidence Index at Nov 24, GDP quarterly report, Core Durable Goods Orders monthly report, Initial Jobless Claims, and FOMC Minutes at Nov 25 for US.  

XAU/USD Weekly outlook:

Technical View:

Last week’s high was 3.39% lower than the previous week. Maintaining high at 1899.0 and low at 1852.6 showed a movement of 464 pips.

In the upcoming week we expect XAU/USD to show a bullish trend.  The Instrument is trading below the 200 Simple Moving Average and the MACD trades to the upside. A solid breakout above 1897.6 may open a clean path towards 1921.4 and may take a way up to 1943.9. Should 1851.2 prove to be unreliable support, the XAUUSD may sink downwards 1828.8 and 1804.9 respectively. In H4 chart Symmetrical Triangle breakout favors prospects of a bullish trend. Also to be noted hammer formation exerts the expectation of uptrend for the pair.

Preference
Buy: 1876.9 target at 1920.8 and stop loss at 1846.5


Alternate Scenario
Sell:  1846.5 target at 1805.7 and stop loss at 1876.9

BTC/USD Weekly Forecast (23rd November 2020 – 27th November 2020)

Fundamental view:

Bitcoin moved up in the last week. Bitcoin has lived through the best week since February 2018. The pioneer digital currency price gained over $2,000 in less than seven days. Bitcoin was influenced by the same old stories like institutional investments, inflation hedge, and a store of value in the view of the imminent fiat collapse. Also, now that the US presidential elections are behind, the level of market uncertainties decreased, making Bitcoin and other risky assets more attractive again. 

Meanwhile, sustainable price growth resulted in increased bullish forecasts from reputable investors and large banks. For instance, a senior executive at US-based financial giant Citibank, Tom Fitzpatrick, mentioned that Bitcoin’s price could surpass $318,000 because it will become a digital version of gold.  

The major economic events deciding the movement of the pair in the next week are Markit Manufacturing PMI at Nov 23, CB Consumer Confidence Index at Nov 24, GDP quarterly report, Core Durable Goods Orders monthly report, Initial Jobless Claims, and FOMC Minutes at Nov 25 for US.  

BTC/USD Weekly outlook:

Technical View:

Last week’s high was 15.25% higher than the previous week. Maintaining high at 18891.6 and low at 15771.1 showed a movement of 3120 pips.

In the upcoming week we expect BTC/USD to show a bullish trend. The Instrument is trading above the 200 Simple Moving Average and the MACD trades to the upside. A solid breakout above 19882.7 may open a clean path towards 20947.3 and may take a way up to 23003.1. Should 16762.3 prove to be unreliable support, the BTCUSD may sink downwards 14706.5 and 13641.9 respectively. In H4 chart Flags pattern formation favors prospects of a bullish trend. Three outside up pattern constructs a bullish outlook for the pair in the upcoming week.

Preference
Buy: 18717.5 target at 20940.9 and stop loss at 17821.9


Alternate Scenario
Sell: 17821.9 target at 16763.5 and stop loss at 18717.5