EUR/USD Weekly Forecast (26th October 2020 – 30th October 2020)

Fundamental view: 

The Euro has shot straight up in the air again during the week, but as you can see continues to struggle with the previous uptrend line that had been so important. Uncertainty about economic growth within the pandemic context, and the upcoming US presidential election made the pair confusing to choose direction till now. With corona virus outbreaks spread like wildfires and government taking tough measures just shy of lockdowns, speculative interest is extremely cautious, and will likely remain so. Vaccines and treatments are still under study and advancing, but there’s no magic solution yet.

US NAHB Housing Market Index on 19th Oct and US Crude Oil Inventories on 21st Oct created bearish trend for the pair whereas Europe German PPI monthly report on 20th Oct and Europe German Flash Manufacturing PMI, Flash Manufacturing PMI on 23rd Oct created bullish trend for the pair.

The major economic events deciding the movement of the pair in the next week are Euro Unemployment Rate at Oct 27, US Core Durable Goods Orders monthly report, US CB Consumer Confidence Index at Oct 27, ECB Interest Rate Decision, US GDP quarterly report at Oct 29, and US Core PCE Price Index yearly report at Oct 30.

EUR/USD Weekly outlook:

Technical View:

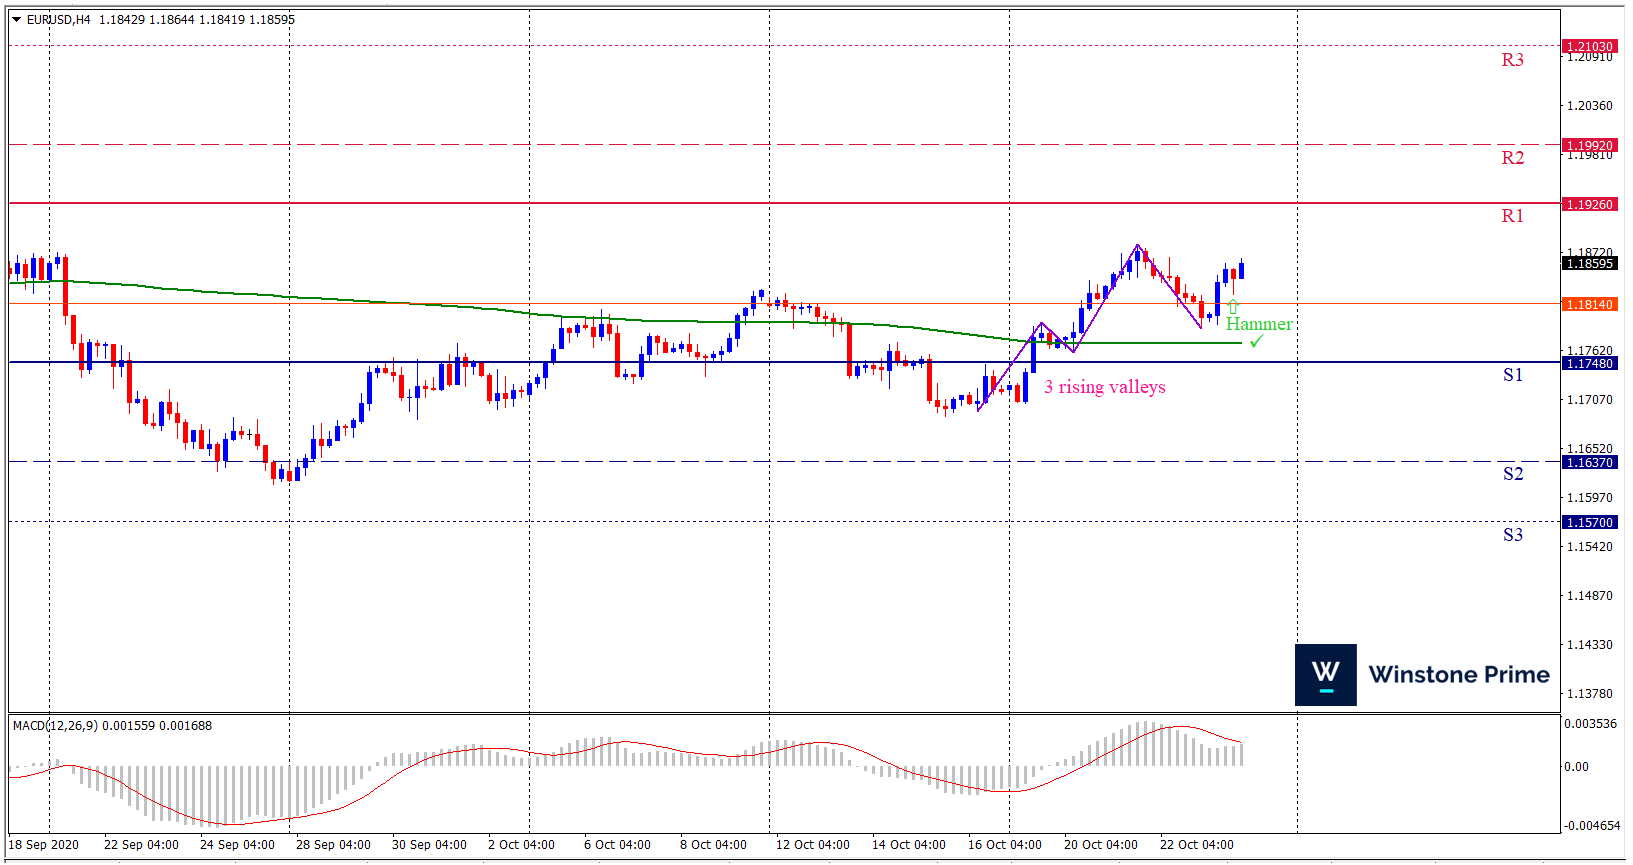
Last week’s high was 0.46% higher than the previous week. Maintaining high at 1.1880 and low at 1.1703 showed a movement of 177 pips.

In the upcoming week we expect EUR/USD to show a bullish trend. The currency pair is trading above the 200 Simple Moving Average and the MACD trades to the upside. A solid breakout above 1.1926 may open a clean path towards 1.1992 and may take a way up to 1.2103. Should 1.1748 prove to be unreliable support, the EURUSD may sink downwards 1.1637 and 1.1570 respectively. Chart formation of a three rising valleys Pattern formation in H4 chart sets prospects for a bullish trend. Hammer formation in H4 chart escalates the expectation for a bullish trend.

Preference
Buy:  1.1855 target at 1.1991 and stop loss at 1.1743


Alternate Scenario
Sell: 1.1743 target at 1.1571 and stop loss at 1.1855

GBP/USD Weekly Forecast (26th October 2020 – 30th October 2020)

Fundamental view:

The British pound has been somewhat bullish during the week but has struggled at the end of the week. This market continues to be one that is going to struggle with the idea of whether or not we get a clean Brexit. The EU and the UK have continued negotiations – on the phone instead of face to face and at various intensity levels. The ongoing communications have kept the pound bid despite posturing. Sterling surged when both sides announced a formal return to formal – and intense – talks, now with a new deadline of mid-November.

Gertjan Vlieghe, a member of the Bank of England, responded to the increase in COVID-19 infections and lockdowns with dovish comments. He said that the outlook risks are skewed toward adding more stimulus and dismissed concerns that negative rates are unproductive.

US NAHB Housing Market Index on 19th Oct and Oil Inventories on 21st Oct created a bearish atmosphere for the pair whereas Britain CPI yearly report & PPI Input monthly report on 21st Oct and Britain Retail Sales monthly report on 23rd Oct created a bullish atmosphere.

The major economic events deciding the movement of the pair in the next week are UK Nationwide HPI yearly report, US Core Durable Goods Orders monthly report, US CB Consumer Confidence Index at Oct 27, BoE Consumer Credit monthly report, US GDP quarterly report at Oct 29, and US Core PCE Price Index yearly report at Oct 30.

GBP/USD Weekly outlook:

Technical View:

Last week’s high was 0.73% higher than the previous week. Maintaining high at 1.3177 and low at 1.2902 showed a movement of 275 pips.

In the upcoming week we expect GBP/USD to show a bullish trend.  The currency pair is trading above the 200 Simple Moving Average and the MACD trades to the downside. A solid breakout above 1.3180 may open a clean path towards 1.3316 and may take a way up to 1.3454. Should 1.2905 prove to be unreliable support, the GBPUSD may sink downwards 1.2766 and 1.2631 respectively. Chart formation of ascending scallop pattern in H4 chart favors prospects of a bullish trend. Spinning top pattern formation escalates the expectation for a bullish trend.

Preference
Buy:  1.3010 target at 1.3217 and stop loss at 1.2900


Alternate Scenario
Sell: 1.2900 target at 1.2632 and stop loss at 1.3010

XAU/USD Weekly Forecast (26th October 2020 – 30th October 2020)

Fundamental view:

Gold showed a mixed trend in the last week. Fiscal stimulus deal has been pushing gold prices higher, while pessimism about a deal held it back. With time running out toward Election Day, the next bout of cash to fuel gold prices mostly depends on the outcome. When President Donald Trump completed his U-turn – from cutting off talks with Democrats to stating he wants a larger deal than them, gold advanced. The same happened when House Speaker Nancy Pelosi expressed optimism about striking an accord.              

The major economic events deciding the movement of the pair in the next week are New Home Sales at Oct 26, Core Durable Goods Orders monthly report, CB Consumer Confidence Index at Oct 27, EIA Crude Oil Stocks Change at Oct 28, GDP quarterly report at Oct 29, and Core PCE Price Index yearly report at Oct 30 for US.

XAU/USD Weekly outlook:

Technical View:

Last week’s high was 0.09% lower than the previous week. Maintaining high at 1931.4 and low at 1894.3 showed a movement of 371 pips.

In the upcoming week we expect XAU/USD to show a bullish trend.  The Instrument is trading below the 200 Simple Moving Average and the MACD trades to the downside. A solid breakout above 1924.3 may open a clean path towards 1946.4 and may take a way up to 1961.4. Should 1887.1 prove to be unreliable support, the XAUUSD may sink downwards 1872.1 and 1850.0 respectively. In H4 chart bullish shark pattern formation favors prospects of a bullish trend. Also to be noted harami pattern formation exerts the expectation of uptrend for the pair.

Preference
Buy: 1910.5 target at 1945.7 and stop loss at 1882.7


Alternate Scenario
Sell:  1882.7 target at 1851.5 and stop loss at 1910.5

BTC/USD Weekly Forecast (26th October 2020 – 30th October 2020)

Fundamental view:

Bitcoin has enjoyed a strong rally in the last week as macro trends have favored its growth. The rally comes as an increasing number of investors, both within crypto and out of crypto, have realized there is a growing fundamental value in owning Bitcoin.

Friday’s U.S. presidential debates may have their own effect on Bitcoin’s price action in the short term as a Democratic lead will be putting more selling pressure on the USD, which will inevitably reflect in a bullish price action in BTC/USD.

The major economic events deciding the movement of the pair in the next week are New Home Sales at Oct 26, Core Durable Goods Orders monthly report, CB Consumer Confidence Index at Oct 27, EIA Crude Oil Stocks Change at Oct 28, GDP quarterly report at Oct 29, and Core PCE Price Index yearly report at Oct 30 for US.

BTC/USD Weekly outlook:

Technical View:

Last week’s high was 13.07% higher than the previous week. Maintaining high at 13230.1 and low at 11398.5 showed a movement of 1832 pips.

In the upcoming week we expect BTC/USD to show a bearish trend. The Instrument is trading above the 200 Simple Moving Average and the MACD trades to the downside. A solid breakout below 11814.1 may open a clean path towards 10690.5 and may take a way down to 9982.5. Should 13645.7 prove to be unreliable resistance, the BTCUSD may raise upwards 14353.7 and 15477.3 respectively. In H4 chart, if breakout of the Symmetrical wedge is to the downside then bearish expectation is favored. Also to be noted Spinning top formation exerts the expectation of downtrend for the pair.

Preference
Sell: 12683.5 target at 11224.9 and stop loss at 13649.5


Alternate Scenario
Buy: 13649.5 target at 15476.2 and stop loss at 12683.5