Dollar clings with the Stimulus package hopes

Having initially played hard on the US Democrats’ easy money demands, which likely weigh his chances of winning in the upcoming presidential elections, Trump tries to convince the market that he is not the reason for the delay in the much-awaited stimulus package. In his latest comments, US President said he wants the biggest stimulus deal that House Speaker Nancy Pelosi’s plan. The White House Chief also mentioned that COVID-19 vaccines will be coming out very soon.

Meanwhile, House Speaker Nancy Pelosi has called on the Trump administration to reconcile remaining disputes on corona virus stimulus legislation within 48 hours as lawmakers attempt to pass a bill before the 2020 election. Pelosi set the 48-hour deadline on negotiations after speaking with Treasury Secretary Steven Mnuchin on Saturday night for more than an hour. They agreed to speak again on Monday.

In an interview on Sunday, Pelosi said the deadline has to do with lawmakers’ ability to get a deal done before the Nov. 3 election, which is just over two weeks away. The speaker said she’s optimistic about negotiations but that the outcome ultimately depends on the White House.

On the other hand, Japan’s September month Trade Balance shrank from ¥989.8 B market consensus to ¥675 B. Details suggest -17.2% figures for Imports versus -21.4% forecast while Exports have dropped from -2.4% expectations to -4.9% YoY during the stated month.

And regarding the election, Fifteen days out from Election Day, Biden leads Trump by about ten points in national polls and has a narrow lead in several battleground states. The pair is due to face off in a final debate on Thursday.

“Markets will be attentive to any potential shift in polls, although traditionally the last debate has less impact in public opinion,” Barclays analysts said in a note. “The main risk for markets now would be a tightening in polls, which would reduce the likelihood of a large Democratic fiscal stimulus package and could raise the likelihood of a long-contested election.”

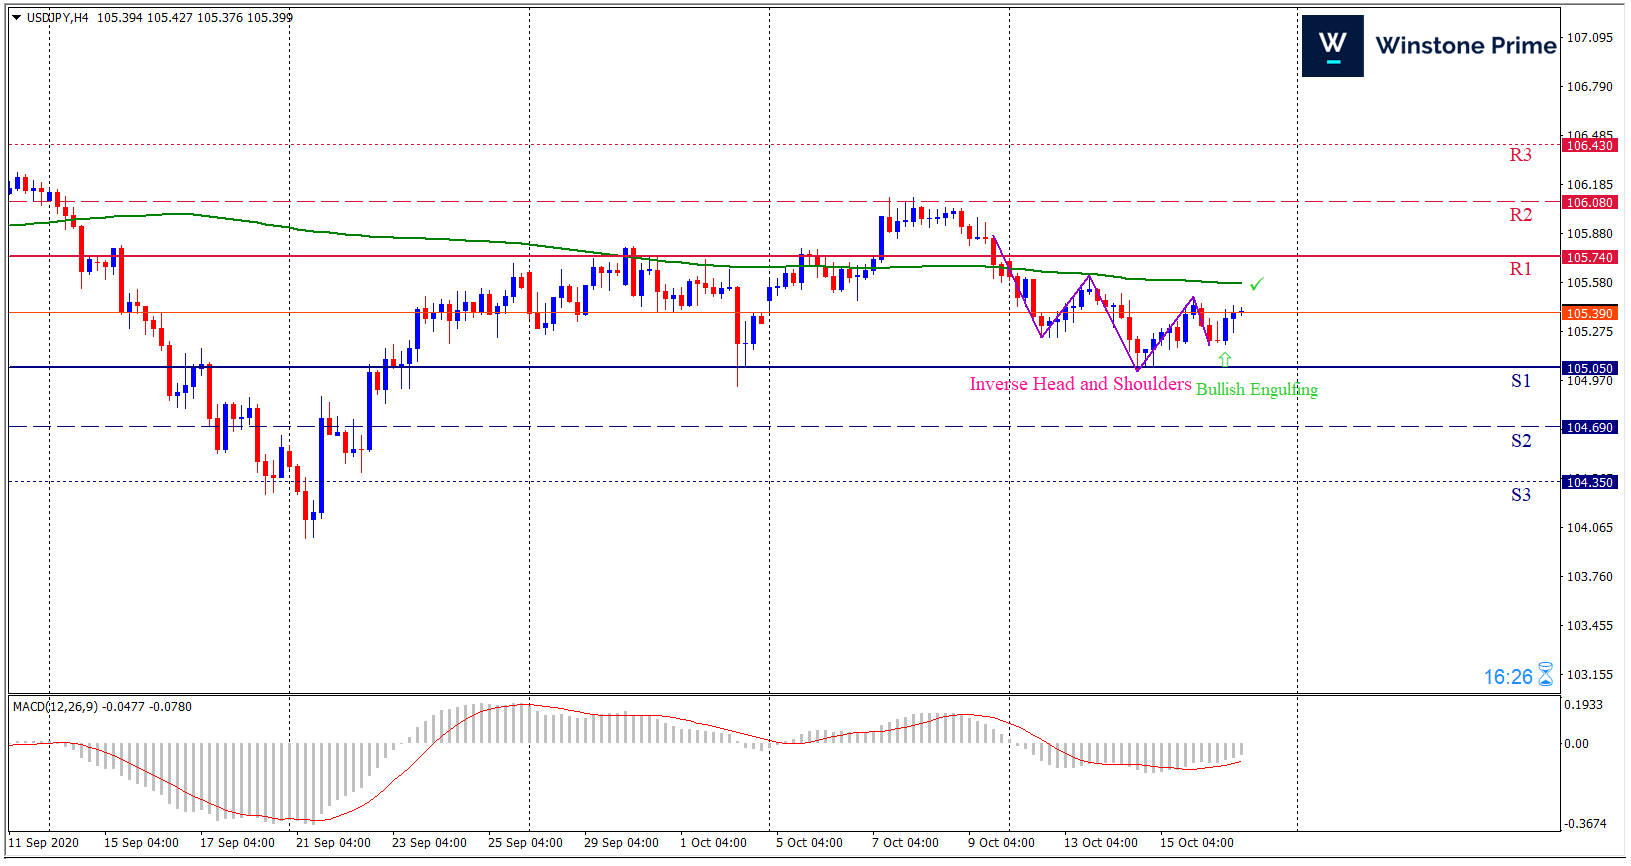
USD/JPY 4 Hour Chart:

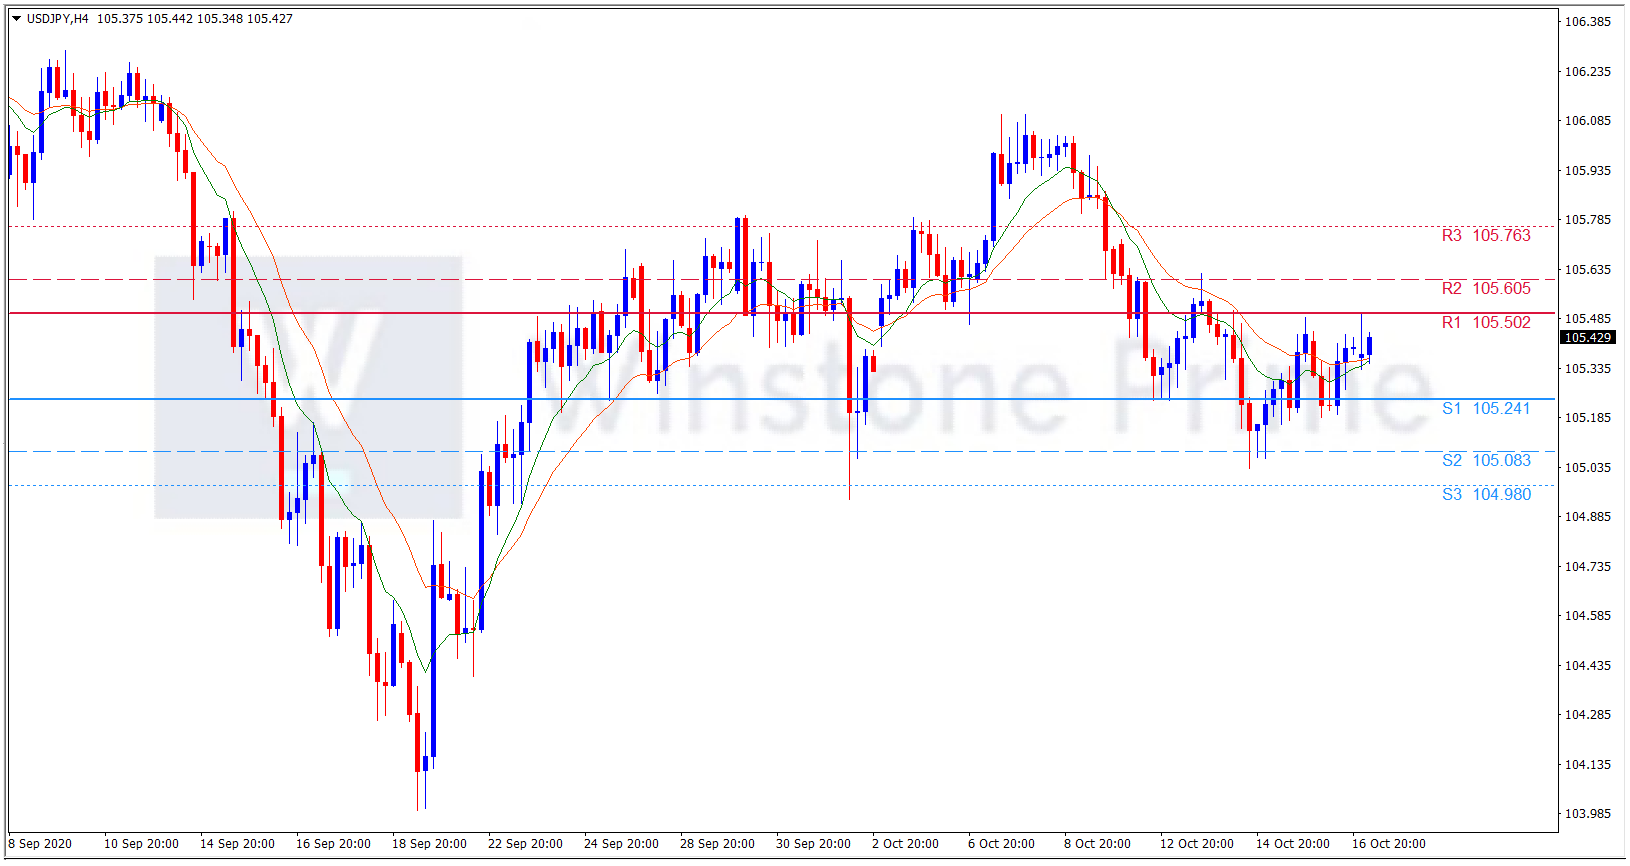
Support: 105.24 (S1), 105.08 (S2), 104.98 (S3).

Resistance: 105.50 (R1), 105.61 (R2), 105.76 (R3).

We expect a bullish trend for USD/JPY. Attention will be given to the speech by Fed Chair Jerome Powell, at noon for the next direction of the market.

AUD/USD Weekly Forecast (19th October 2020 – 23rd October 2020)

Fundamental view:

The Australian dollar has broken down significantly during the week, to reach through the 0.70 handle. The commodity-linked currency declined, however, after the Reserve Bank of Australia’s Governor Philip Lowe hinted an upcoming rate cut.  Speaking at the Citi Group annual investment conference on Thursday, Lowe said further monetary easing would support jobs growth and alleviate currency pressures, hinting a possible cut to a record low of 0.1%. Extraordinary monetary stimulus is no surprise to investors in the current pandemic scenario that put the world in recession.

US Unemployment Claims and Empire State Manufacturing Index on 15th October created a bullish atmosphere for the pair whereas US NFIB Small Business Index on 13th October and US Core PPI on 14th October created a bearish environment for the pair.

The major economic events deciding the movement of the pair in the next week are Fed Chair Powell Speech at Oct 19, RBA Meeting Minutes, US Building Permits at Oct 20, Australia Retail Sales monthly report at Oct 21, US Initial Jobless Claims at Oct 22, and US Markit Manufacturing PMI at Oct 23.

AUD/USD Weekly outlook:

Technical View:

Last week’s high was 0.11% lower than the previous week. Maintaining high at 0.7234 and low at 0.7056 showed a movement of 179 pips.

In the upcoming week we expect AUD/USD to show a bearish trend.  The currency pair is trading below the 200 Simple Moving Average and the MACD trades to the downside. A solid breakout below 0.7010 may open a clean path towards 0.6943 and may take a way down to 0.6831. Should 0.7188 prove to be unreliable resistance, the AUDUSD may raise upwards 0.7301 and 0.7367 respectively. In H4 chart descending triangle breakout favors prospects of a bearish trend. Also to be noted Bearish engulfing formation exerts the expectation of downtrend for the pair.

Preference
Sell: 0.7080 target at 0.6944 and stop loss at 0.7192


Alternate Scenario
Buy:  0.7192 target at 0.7366 and stop loss at 0.7080

USD/JPY Weekly Forecast (19th October 2020 – 23rd October 2020)

Fundamental view:

The US dollar has initially fallen during most of the week to reach down towards the ¥105 level again. This is an area that has been supportive in the past, and now that it has been recaptured that it is going to see a lot of choppiness. This is due to the fact that there are two major drivers of this currency pair most of the time, and that is risk appetite and the 10 year yields of both countries.

US NFIB Small Business Index on 13th October and US Core PPI monthly report on 14th October made a bullish environment for the pair whereas Japan Core Machinery Orders monthly report on 12th October favored bearish atmosphere for the pair.

The major economic events deciding the movement of the pair in the next week are Fed Chair Powell Speech at Oct 19, US Building Permits at Oct 20, Core CPI yearly report, US Initial Jobless Claims at Oct 22, Japan and US Markit Manufacturing PMI at Oct 23.

USD/JPY Weekly outlook:

Technical View:

Last week’s high was 0.36% lower than the previous week. Maintaining high at 105.73 and low at 105.03 showed a movement of 69 pips.

In the upcoming week we expect USD/JPY to show a bullish trend. The currency pair is trading below the 200 Simple Moving Average and the MACD trades to the upside. A solid breakout above 105.74 may open a clean path towards 106.08 and may take a way up to 106.43. Should 105.05 prove to be unreliable support, the USDJPY may sink downwards 104.69 and 104.35 respectively. In H4 chart, Formation of Inverse Head and Shoulders indicates reversal of the trend creating prospects of a bullish trend Along with a bullish engulfing formation braces our expectation.

Preference
Buy: 105.38 target at 106.05 and stop loss at 104.99


Alternate Scenario
Sell:  104.99 target at 104.36 and stop loss at 105.38

BTC/USD Weekly Forecast (19th October 2020 – 23rd October 2020)

Fundamental view:

Bitcoin price movement showed a high at the $11600 mark on 15 October however, the increased volatility pulled the price back down in a flash crash. After the flash crash on the 16th of October, Bitcoin price fell to the $11240 mark, and despite a slight recovery, hit the lowest point of $11219 twice in a row. The king managed to rise above the $11300 mark since, but the continued volatility tells a different tale as the US gained some strength due to some positive updated like the US stimulus deal.

By 2025, bitcoin (BTC) still could add another zero to its price, according to Bloomberg Intelligence, while they also claim that it’s possible for the price to get closer USD 14,000 again already this year.

In their latest Crypto Outlook, Bloomberg Intelligence’s senior commodity strategist, Mike McGlone, wrote that “bitcoin has a history of adding zeroes.” Bitcoin’s price could continue appreciating on the back of increasing adoption, as it has done so far, but this would happen at a slower pace. This update favors Bitcoin.

The major economic events deciding the movement of the pair in the next week are Fed Chair Powell Speech at Oct 19, Building Permits at Oct 20, EIA Crude Oil Stocks Change at Oct 21, Existing Home Sales at Oct 22, and Markit Manufacturing PMI at Oct 23 for US.

BTC/USD Weekly outlook:

Technical View:

Last week’s high was 2.04% higher than the previous week. Maintaining high at 11701.6 and low at 11183.6 showed a movement of 518 pips.

In the upcoming week we expect BTC/USD to show a bullish trend. The Instrument is trading above the 200 Simple Moving Average and the MACD trades to the upside. A solid breakout above 11604.8 may open a clean path towards 11912.2 and may take a way up to 12122.8. Should 11086.8 prove to be unreliable support, the BTCUSD may sink downwards 10876.2 and 10568.8 respectively. In H4 chart bullish bat pattern formation favors prospects of a bullish trend. Bullish harami pattern constructs a bullish outlook for the pair in the upcoming week.

Preference
Buy: 11318.4 target at 11845.7 and stop loss at 11081.8


Alternate Scenario
Sell: 11081.8 target at 10569.5 and stop loss at 11318.4