A forex economic calendar is useful for traders to learn about upcoming news, events that can shape their fundamental analysis. Fundamental Analysis shows you the core reasons why currency prices move. So it’s also a fact that you can always be one step ahead, primed and ready to take full advantage of the market before it moves.
It may affect movement of individual security prices or markets as a whole or part and you can spend a minute within a day or less but it could be become a consistently profitable trader for you with the moment of markets.
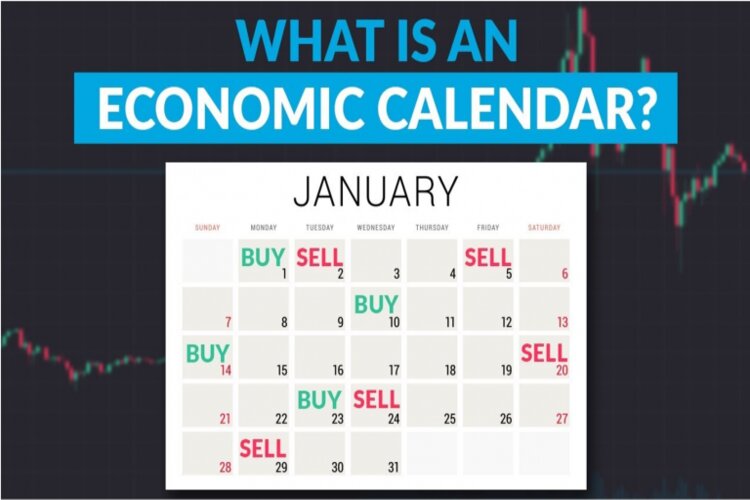
What is an Economic Calendar?
The economic calendar is a clear schedule, known in advance and it is free to be found on the Internet as many websites are offering it. This is where the Economic Calendar comes in handy for traders. Instead of searching the headlines of hundreds of different financial publications, a trader can use the Economic Calendar to see what financial news will be released and when.
Checklist of Economic Calendar
There are a lot of things to look at when studying the economic calendar and the following list should be a check list with the most important ones:
- The date of the Economic Calendar
There is the date that the trader is interested in as the economic calendar is not only showing the economic events that are supposed to be released in the future but also the previous ones. So, if you are interested in finding a trend or what the previous data was and looking for a comparison then you can select the period. - Which currency market got Influents with the news
There is nothing more important than knowing which currency is influenced. If the news is coming out of Eurozone, then the Euro is going to move much so look for the Euro pairs to move the most. If the news is coming out of Australia, then Australian dollar pairs are going to be more active. If the news on the other hand is coming out of China, then still the Australian dollar is influenced the most as it is a well-known fact that Australian exports are going mostly in China. - Forecast of the data
The next thing to look at is of course the previous release, then the forecasted value to be released and of course the actual. If the actual is bigger that the forecasted values then that is bullish for the currency and depending on the currency pair that is traded. If reports indicate a weakness of a currency, the Sell order is in place and vice versa.
Indicators of Economic Calendar
An economic calendar contains a list of many important economic indicators that are required to make an informed decision. The below mentioned indicators decorates the economic calendar. Some of the economic indicators in an economic calendar should be:
Personal Income & Outlays
The Personal Income & Outlays Reports is often issued every month. The report provides insight into the behavior of consumers and the overall economic consumption. The Personal Income & Outlays can be measured in terms of dollars. The report is considered extremely influential in terms of the economy’s future direction, even more than the CPI (Consumer Price Index).
Producer Price Index
The Producer Price Index is a weighted price index that is measured at the producer level or at the wholesale level, excluding imports. One of the most important figures in the reports is the Producer Price Index and Industry Index figure which factors in the final stage manufacturing price, minus volatile energy and food components. The report is a valuable indicator for inflation. In addition, it is an encouraging report that has a positive effect on the markets.
Productivity report
The Productivity report plays an important role in measuring the levels of output that have been achieved by organizations per labor unit, using previously released GDP (Gross Domestic Product) and labor figures. Gains in productivity have resulted in gains in actual or real income, increased profitability at the corporate level and lower inflation. It can prove helpful to investors because it provides answers for complex calculations which can be difficult and time-consuming if done on its own.
Purchasing Manager Index (PMI)
The Purchasing Manager Index is a headline indicator for all the monthly reports issued. It is an indicator that is derived from 5 sub-indicators, namely the Production Level, Supplier Deliveries, New Orders, Employment Level and Inventories. It is an important indicator for manufacturing as well as the economy in general. A rating of above 50 indicates that the industry and economy are expanding. A rating of above 42 indicates the GDP has a high chance of expanding, while a rate below 42 indicates a recession could be on its way.
Employment Cost Index (ECI)
A quarterly economic series that indicates the rising and falling tendencies in employment costs. It measures inflation in salaries, wages and employer-paid benefits in the US.
Unemployment Rate
The percentage of unemployed people, measured by the ratio of individuals who are out of work and who are willing and able to work as opposed to the total number of individuals in the work force. It is lagging indicator as it changes along with economy, and it shows future interest rates and monetary policies.
Non-farm Payroll Employment
A monthly report released by the US Department of Labor that provides statistical data about the current state of the US labor market. It is also used to forecast future levels of economic activity.
Gross Domestic Product (GDP)
It indicates the economic growth of a country, and it is determined by product output, income and expenditure. GDP is often correlated with the living standard. It is the market value of all services and goods produced in a country during a certain time period.
Industrial Production (IP)
An indicator for the changes in output in the industrial sector (e.g. manufacturing, mining). It indicates the industrial capacity of a country.
International Trade (trade balance)
It measures the difference imports vs exports of all goods and services. Changes in imports and exports, together with the level of the international trade balance, indicate market trends.
Retail Sales
A monthly report that measures consumer expenditure (an essential indicator of GDP in the US). As a timely indicator of broad consumer spending patterns, it can be used to assess the immediate direction of an economy.
How to use an Economic Calendar
Alright, we have gone through about Economic calendar, checklist of it and Indicators of an Economic calendar. Now we are going to learn about How to use an Economic calendar. Now we are in our Winstone prime Economic Calendar.
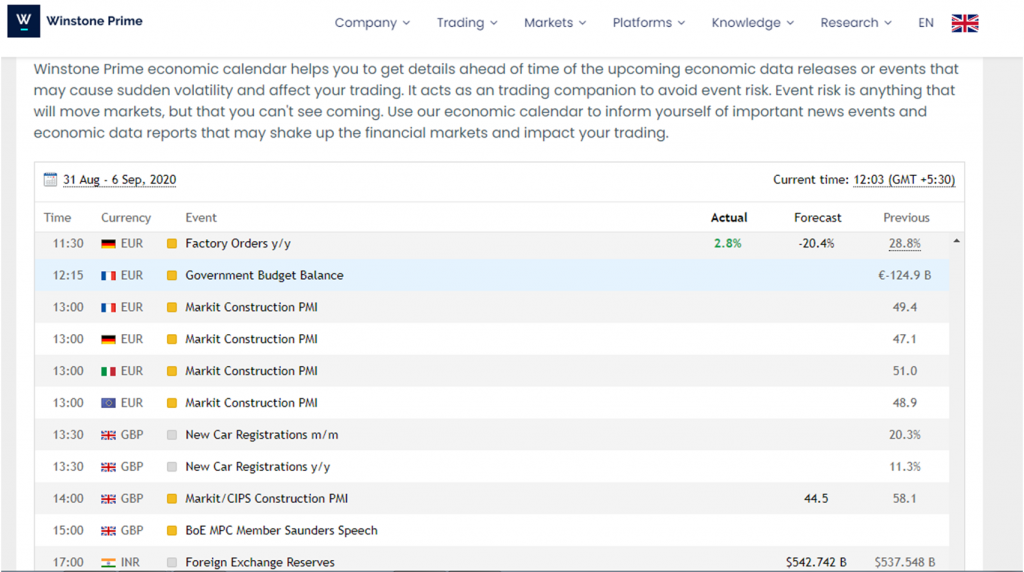
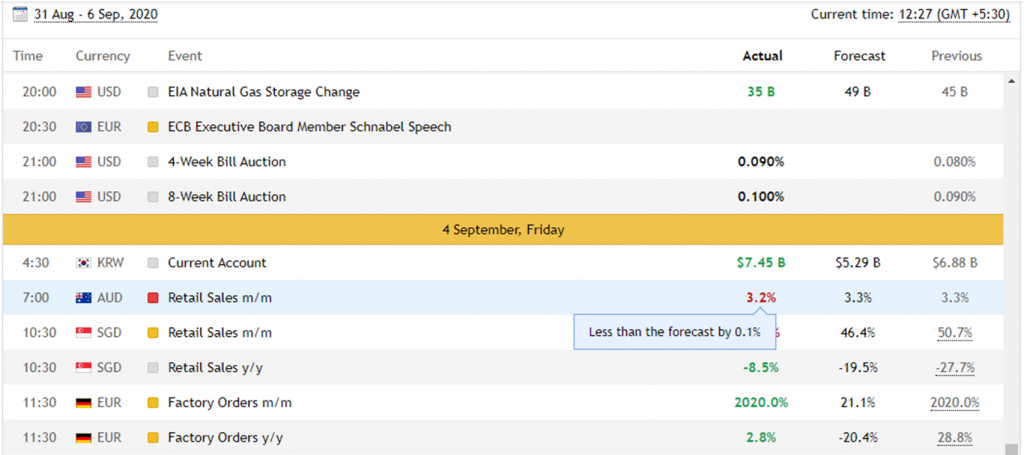
As you can see, we are at our website winstoneprime.com, and what you have to do is just click on calendar and it’ll prompt you to the calendar page. As you can see, we have selected the entire last week from Aug 24th to 30th of 2020. But of course, you can filter out or you can just select today’s news, tomorrow’s news, and yesterday’s news to review the data that has come on the wires. Now, we’re going to scroll down into today’s news, well this week’s news, and we’re going to go through what every one of these numbers mean.
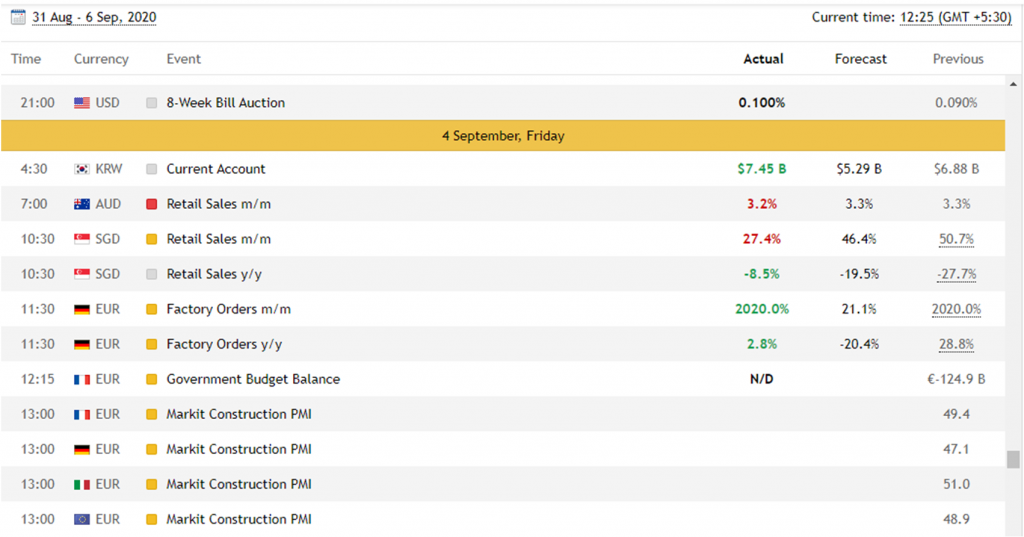
Now, let’s focus on the Australian Dollar. We have an official bank rate and asset purchase facility. If you don’t know what these are, you can always click on data which is to be released or else if it’s already released here it is AUD Retail Sales m/m and it’ll tell you all the specs that you need to know.
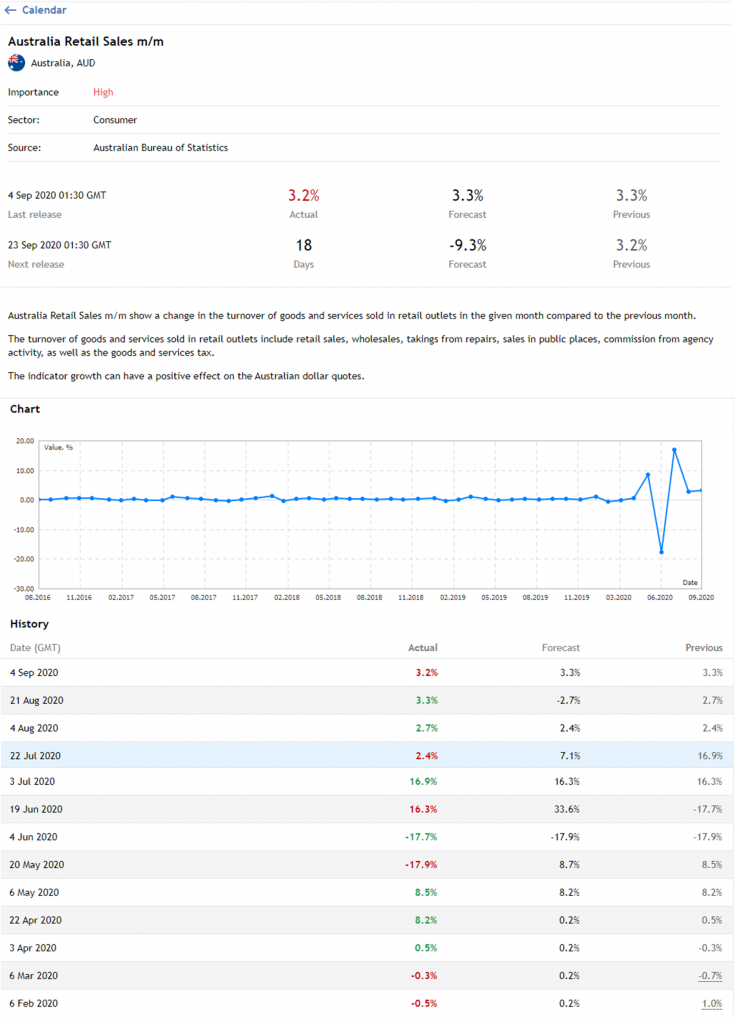
The Retail Sales released by the Australian Bureau of Statistics is a survey of goods sold by retailers is based on a sampling of retail stores of different types and sizes and it’s considered as an indicator of the pace of the Australian economy. It shows the performance of the retail sector over the short and mid-term.
As you can see, we have the actual number after the release comes out. Before the release comes out, we only have the forecast and the previous number. In this case, you just click on the data which is to be released, you are going to get all the previous numbers and you can get all sorts of graph of the actual change. This is how you hover through the Economic Calendar on Winstone Prime.
Key points
- Forex economic calendar can be used in strategy trading. You must Know what events can be used as great entry and exit points.
- Keep track of the most important events. Not every event will have an effect on the market, focus solely on the ones you need.
- Keep away from dangerous volatility. Some markets are just too unpredictable to be a part of, therefore you should know when to stay away.
- Make smart decisions while everyone else is panicking. Be the one with a plan when other traders are struggling to understand why the market is acting so erratically.
Conclusion :
Without an economic calendar, Forex trader would hardly know when to act (and even still, what action to take!). If you are going to react quickly and effectively to the ever-changing currency markets, you will have to make absolutely sure you know what is happening, and when. It probably is not a bad idea to check a calendar once a day and record any changes to the market, which would allow the savvy investor to react accordingly. In both bullish and bearish markets there are opportunities – as long as you know which one is likely to set in and what changes it will bring along. This is where Winstone Prime economic calendar will definitely help you.