GBP/USD Weekly Forecast (12th October 2020 – 16th October 2020)

Fundamental view:

British pound initially fell during the week but then turned around to show signs of strength again. Early in the week, US President Donald Trump left the hospital as he recovers from his COVID-19 episode, and abruptly cut off talks with Democrats. However, sinking stocks and tumbling poll figures probably convince the commander-in-chief to change tack, which could boost markets, and weigh on the safe-haven dollar. 

Britain Housing Equity Withdrawal on 6th Oct and Britain HPI yearly report on 7th October created downtrend for the pair whereas Britain RICS House Price Balance on 8th October and US Unemployment Claims on 8th October created uptrend for the pair.

The major economic events deciding the movement of the pair in the next week are BoE Governor Bailey Speech Oct 12, UK Claimant Count Change, BoE Governor Bailey Speech Oct 13, Federal Budget Balance at Oct 13, US Initial Jobless Claims at Oct 15, and US Retail Sales monthly report at Oct 16.

 GBP/USD Weekly outlook:

Technical View:

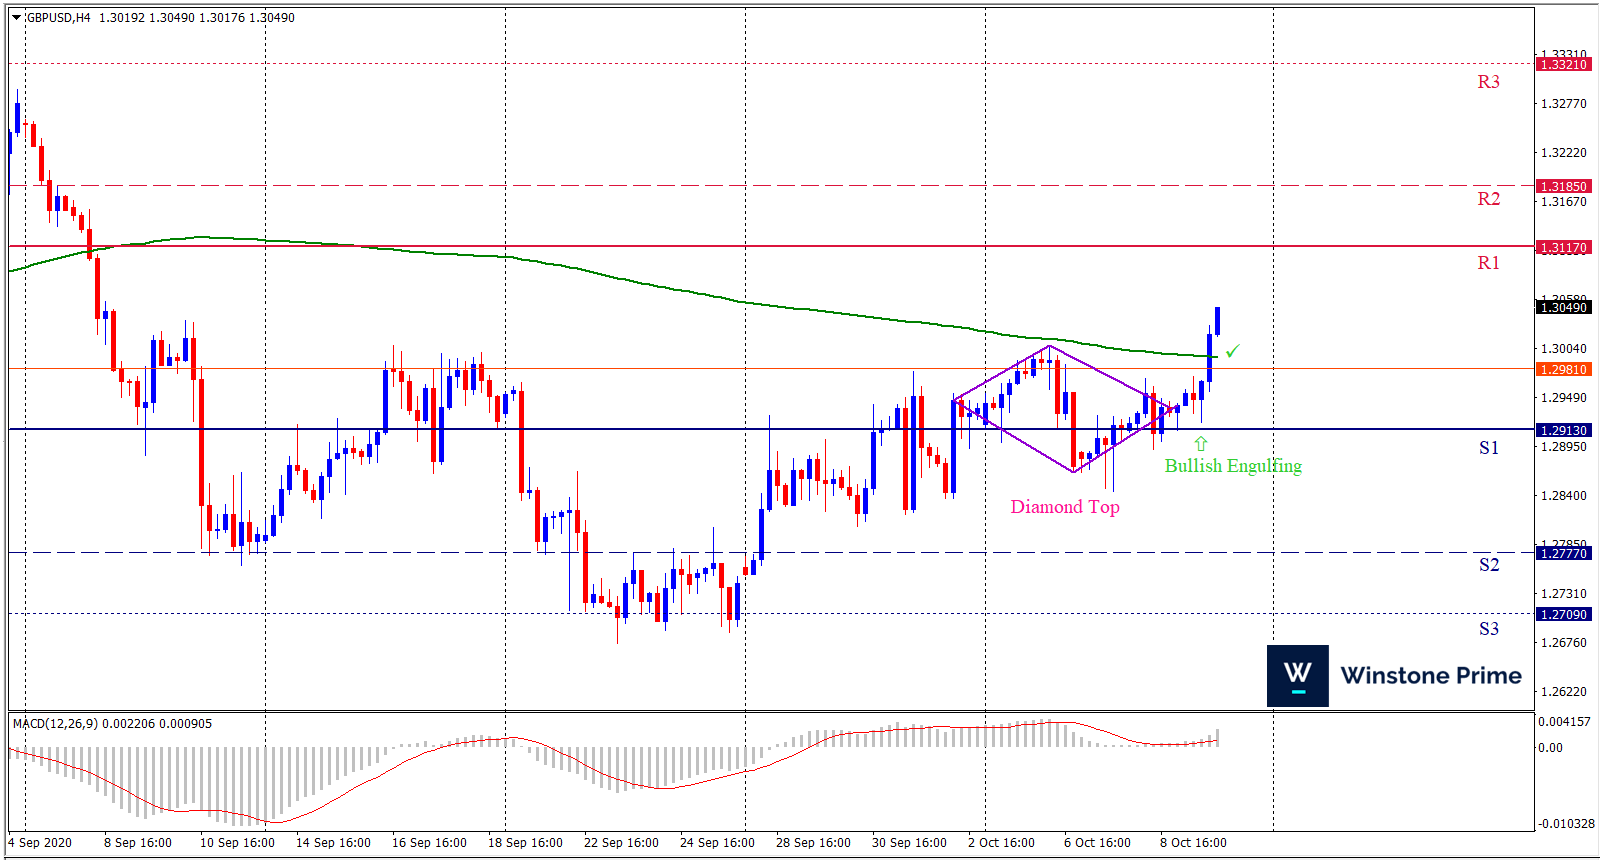
Last week’s high was 0.55% higher than the previous week. Maintaining high at 1.3049 and low at 1.2845 showed a movement of 204 pips.

In the upcoming week we expect GBP/USD to show a bullish trend.  The currency pair is trading above the 200 Simple Moving Average and the MACD trades to the upside. A solid breakout above 1.3117 may open a clean path towards 1.3185 and may take a way up to 1.3321. Should 1.2913 prove to be unreliable support, the GBPUSD may sink downwards 1.277 and 1.2709 respectively. Chart formation of diamond top pattern in H4 chart favors prospects of a bullish trend. Bullish engulfing pattern formation escalates the expectation for a bullish trend.

Preference
Buy:  1.3048 target at 1.3241 and stop loss at 1.2908


Alternate Scenario
Sell: 1.2908 target at 1.2711 and stop loss at 1.3045

BTC/USD Weekly Forecast (12th October 2020 – 16th October 2020)

Fundamental view:

The price of Bitcoin (BTC) has seen a recovery during the past week, surging by nearly 6.5% since Oct. 2. The resilience of the dominant cryptocurrency has traders pleasantly surprised, as many analysts anticipated a larger pullback. Following BTC’s rebound above the critical $10,500 support level to just over $11,000, the sentiment turned optimistic.

There are several key factors that aided the recovery of Bitcoin from the initial drop below $10,500. First, the U.S. dollar has declined in the past 14 days, indirectly causing BTC and gold to rally. Second, the news around Square’s $50 million Bitcoin purchase lifted the overall sentiment. Third, some analysts state that BTC was bullish before the Square news happened, with a favorable technical structure.

The major economic events deciding the movement of the pair in the next week are Federal Budget Balance, Core PPI monthly report at Oct 13, Initial Jobless Claims, EIA Crude Oil Stocks Change at Oct 15, and Retail Sales monthly report at Oct 16 for US.

BTC/USD Weekly outlook:

Technical View:

Last week’s high was 1.43% higher than the previous week. Maintaining high at 11089.3 and low at 10506.4 showed a movement of 582 pips.

In the upcoming week we expect BTC/USD to show a bullish trend. The Instrument is trading above the 200 Simple Moving Average and the MACD trades to the upside. A solid breakout above 11269.7 may open a clean path towards 11471.0 and may take a way up to 11852.6. Should 10686.8 prove to be unreliable support, the BTCUSD may sink downwards 10305.2 and 10103.9 respectively. In H4 chart Pennant pattern breakout favors prospects of a bullish trend. Bullish engulfing  pattern formation constructs a bullish outlook for the pair in the upcoming week.

Preference
Buy: 11081.5 target at 11470.4 and stop loss at 10882.7


Alternate Scenario
Sell: 10882.7 target at 10306.8 and stop loss at 11081.5

USD/JPY Weekly Forecast (12th October 2020 – 16th October 2020)

Fundamental view:

The USD/JPY showed a mixed trend in the last week. There’s still plenty of uncertainty, and USD/JPY trading is volatile since both the U.S. dollar and the Japanese yen serve as safe haven assets. The market continues to be driven based upon the idea of stimulus and risk appetite, which of course is all over the place. With that in mind, we expect an short term downtrend for the pair in the upcoming week.

US Trade Balance on 6th October and Japan Current Account on 8th October favored downtrend for the pair whereas US ISM Services PMI on 5th October and Unemployment Claims on 8th October favored uptrend for the pair.

The major economic events deciding the movement of the pair in the next week are Federal Budget Balance, US Core PPI monthly report at Oct 13, Japan Industrial Production monthly report at Oct 14, US Initial Jobless Claims, Japan Tertiary Industry Activity Index monthly report, at Oct 15, and US Retail Sales monthly report at Oct 16.

USD/JPY Weekly outlook:

Technical View:

Last week’s high was 0.29% higher than the previous week. Maintaining high at 106.10 and low at 105.40 showed a movement of 70 pips.

In the upcoming week we expect USD/JPY to show a bearish trend. The currency pair is trading below the 200 Simple Moving Average and the MACD trades to the downside. A solid breakout below 105.32 may open a clean path towards 105.01 and may take a way down to 104.61. Should 106.02 prove to be unreliable resistance, the USDJPY may raise upwards 106.41 and 106.72 respectively. In H4 chart, Formation of rounding top pattern indicates reversal of the trend creating prospects of a bearish trend Along with a bearish spinning top formation braces our expectation.

Preference
Sell:  105.65 target at 105.02 and stop loss at 106.07


Alternate Scenario
Buy: 106.07 target at 106.71 and stop loss at 105.65

EUR/USD Weekly Forecast (12th October 2020 – 16th October 2020)

Fundamental view:

The pair rallied significantly during the week, as traders are looking for that cheap money coming out of the Federal Reserve or perhaps stimulus from Congress.  The president’s corona virus episode gripped global headlines. After receiving strong medications and spending three days in the hospital, Trump returned triumphantly to the White House and sounded upbeat. His doctors insisted he is still “not out of the woods,” and fears receded. The concerns that his situation is worse than the strongman’s image he would like to portray pressurizes the dollar.  US Trade Balance on 6th October and Europe French Trade Balance & French Trade on 7th October favored bearish move for the pair whereas Europe Final Services PMI & Retail Sales monthly report on 5th Oct and US Unemployment Claims on 8th October favored bullish move for the pair.

After Jerome Powell, Chairman of the Federal Reserve, Trump’s surprise urged lawmakers to approve further stimulus and painted a worrying picture of the economy. While the ISM Services Purchasing Managers’ Index beat estimates, COVID-19 cases are rising in most US states, and without government support, the recovery could be further derailed. Amidst all these catalysts we expect an bullish trend for the pair in the upcoming week.

The major economic events deciding the movement of the pair in the next week Balance are ZEW Economic Sentiment Indicator, Federal Budget, US Core PPI monthly report at Oct 13, US Initial Jobless Claims, EU Leaders Summit Oct 15, and US Retail Sales monthly report at Oct 16.  

EUR/USD Weekly outlook:

Technical View:

Last week’s high was 0.52% higher than the previous week. Maintaining high at 1.1830 and low at 1.1708 showed a movement of 122 pips.

In the upcoming week we expect EUR/USD to show a bullish trend. The currency pair is trading above the 200 Simple Moving Average and the MACD trades to the upside. A solid breakout above 1.1870 may open a clean path towards 1.1911 and may take a way up to 1.1992. Should 1.1748 prove to be unreliable support, the EURUSD may sink downwards 1.1667 and 1.1626 respectively. Chart formation of an ascending scallop pattern in H4 chart sets prospects for a bullish trend. Spinning top formation in H4 chart escalates the expectation for a bullish trend.

Preference
Buy:  1.1823 target at 1.1910 and stop loss at 1.1745


Alternate Scenario
Sell: 1.1745 target at 1.1627 and stop loss at 1.1823