Australia’s budget supports Aussie

AUD/USD is up for the key moves as not only the Reserve Bank of Australia’s (RBA) but the Aussie budget is also ready for publishing, respectively around 03:30 GMT and 08:30 GMT, on Tuesday. The Reserve Bank of Australia (RBA) held its cash rate and the targeted yield on 3-year bonds unchanged at 0.25% during the latest announcement.

The Aussie government is also to publish budget details and is largely expected to announce a take cut after already unveiling multi-billion Aussie dollars worth of infrastructure spending plan. Considering the current economic scenario of Australia, Westpac said, “The deficit has ballooned to a forecast -$240bn (12.5% of GDP) for 2020/21, from -$85.3bn for 2019/20 and a near-balanced budget in 2018/19. The reason of course is the COVID-19 pandemic, the ensuing severe recession, and the necessary policy response. The deficit is then expected to narrow to -$115bn in 2021/22 as the economy reopens and activity rebounds. Policy measures add an expected $179bn to the budget in 2020/21 and $73bn in 2021/22. This includes an expected October budget package of $45bn for this year and $66bn for 2021/22. The key budget strategy is to lift the economy to a higher growth path, enabling progress to be made in reducing the unemployment rate.”

Australia’s prudential regulator introduced on Tuesday a new supervisory system to strengthen its focus on non-financial risks for banks, insurers, and pension funds. The regulator updated its model for assessing risks due to the emergence and prominence of other prudential risks, such as failures of corporate governance, accountability, culture, remuneration, and cybersecurity, it said.

The new “risk and intensity” system will replace the “probability and impact of failure” models the Australian Prudential Regulation Authority (APRA) has used since 2002, it said in a letter to banks, insurers and funds.

Elsewhere, the US President Donald Trump’s risk tone did not support the greenback as market chatters that Trump isn’t well were the White House announcements ordering people to wear PPE kit while nearing Mr. President and also stating the 24-hour case for the Republican leader. Further, no schedules for Tuesday for the US President Trump also pushed market players to become cautious.

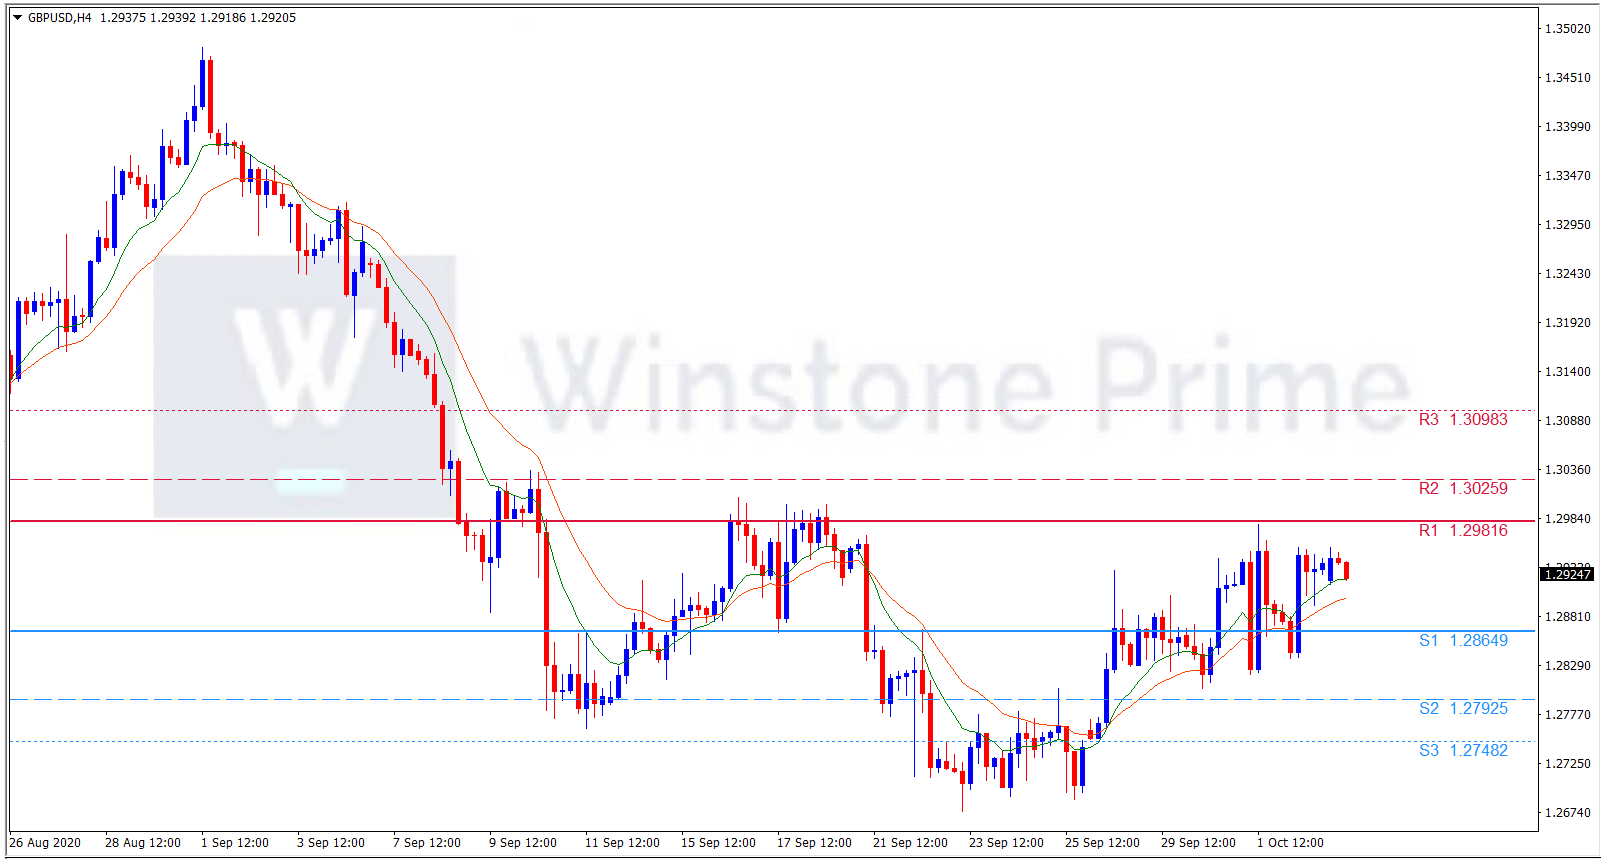
AUD/USD 4 Hour Chart:

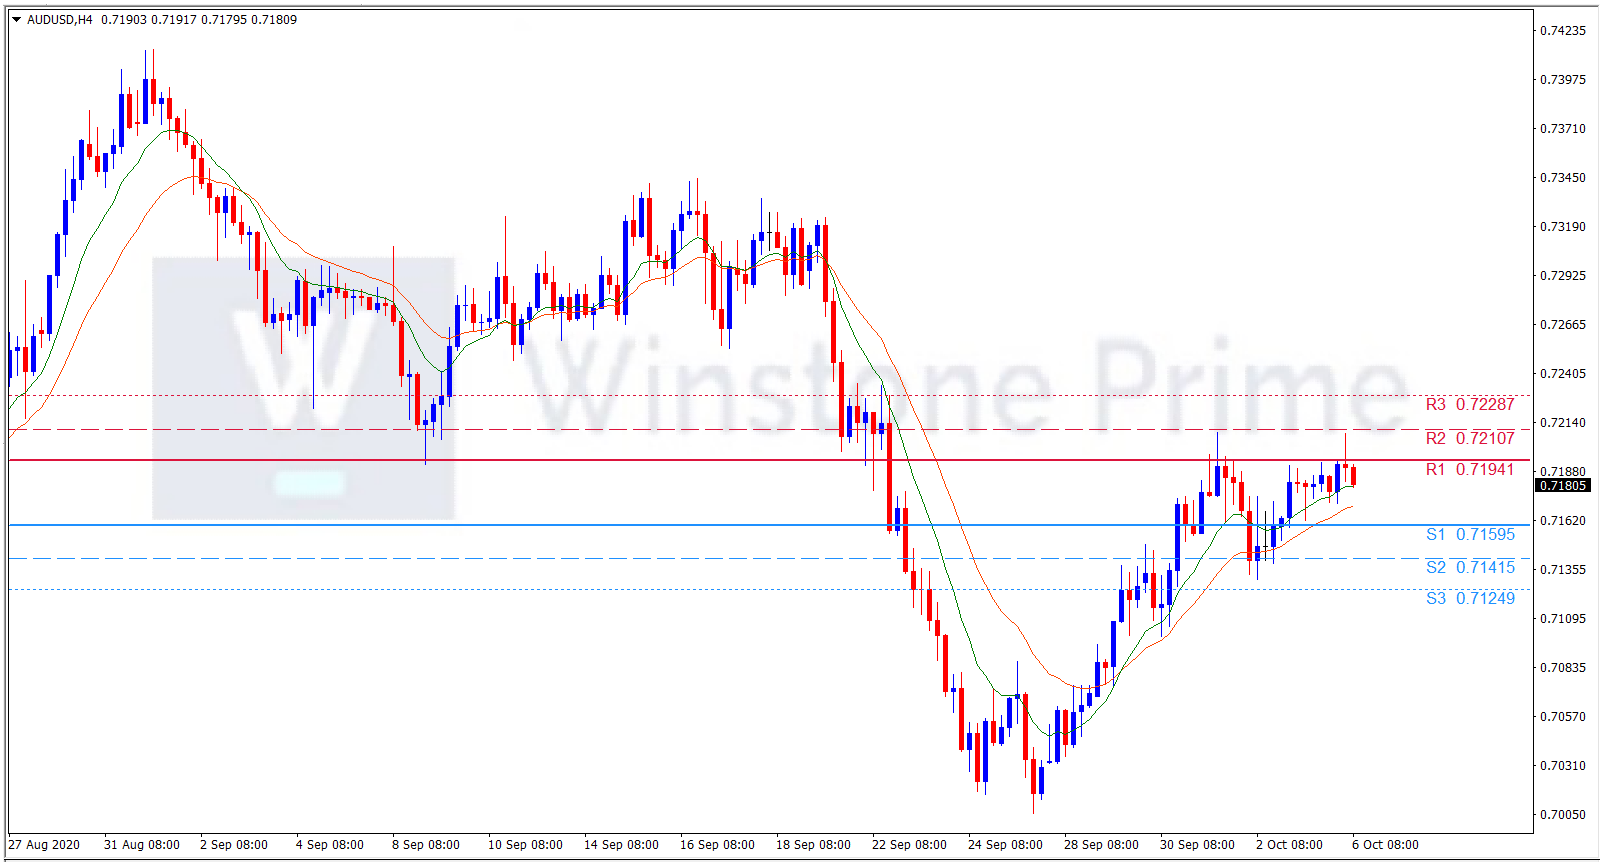
Support: 0.7160 (S1), 0.7142 (S2), 0.7125 (S3).

Resistance: 0.7194 (R1), 0.7211 (R2), 0.7229 (R3).

Amid the optimism regarding the Aussie budget, we expect a bullish trend for AUD/USD.

Symmetrical triangle chart pattern – Trading Strategy

The symmetrical triangle chart pattern is considered as a continuation chart pattern that forms in the shape of a triangle. What this means is this chart pattern can form in a bull market or a bear market. Although symmetrical triangles are regarded as a continuation pattern in the direction of a long-term trend but they can mark the end of the current trend as a reversal pattern given the right context.

Characteristics Of  The Triangle Chart Pattern :

  • Resistance and Support trend line – There needs to be two points at the top to from a resistance level using a trend line. Two points at the bottom to the support level.
  • Apex – The lines will converge into what is called the apex. Price will form higher lows and lower highs in the case of an uptrend as price narrows in range.
  • Breakout of resistance – The rule of thumb is in an uptrend; break out of resistance is expected.
  • Breakout of Support – In a down trend, support level break is expected.
  • Actual break – We don’t know for certain which ways it will break so need confirmation of an actual break before trading it.
  • Important rule: Fading the break when price is close to the apex is often times a losing play. While it may be a false breakout, the odds are a break with momentum will continue in the direction of the break.


The symmetrical triangle chart pattern trading strategy is also considered as a price action trading strategy which means we really don’t need to use any indicators at all with it, but just the ability to recognize the chart pattern when it’s forming and then take trades on it.

Keys to Trading the Symmetrical Triangle Pattern :

Two important things to trade the symmetrical triangle chart patterns successfully:

  • Symmetrical Triangle formation can happen anyplace on the chart but look for a momentum thrust in the direction of the trend as first “on alert” signal.
  • If an uptrend is found for example a lower high and higher low form, start looking for the second point to draw a trend line.
  • Profit target can be a measured move; take the largest zone of the triangle and project it from the area of the break near the apex to give a price target for profit taking.

Trade with the Symmetrical Triangles :

  • Wait and watch for a candlestick to breakout of the triangle pattern on any time frame although higher time frames have better results. The candlestick must then close outside the descending or ascending trend line.
  • After the Candlestick closes, depending on which side the candlestick closes, either place a buy stop/sell stop order 2-5 pips from the closing price of that candlestick.
  • Set take profit target equal to the “pattern height.”( refer to the above chart )


Setting stop loss order :

  • If we placed a buy stop order, place stop loss anywhere from 10-30 pips(this depends on what time frame is used) under the low of the candlestick that broke out of the triangle chart formation OR…place stop loss on the other side of the triangle chart formation…that is if we were to take a sell trade, where we could have placed our sell stop order then this is where we place stop loss. Stop loss placement on this area is quite effective as we would have less chance of being stopped out prematurely.
  • Place it at halfway point between the descending and ascending trend lines just right where the breakout happens.
  • If Sell stop order is placed then place stop loss 10-30 pips above the high of the candlestick that broke the triangle pattern.

Trade Management :

  • When trade moves in profit and is halfway towards hitting its profit target, move stop loss break even to minimize risk.
  • Or you can take half of the profits and leave the other half running which is known as trailing stop.
  • Also continue to lock profits by moving stop loss and trailing it behind higher swing lows as price moves upwards to profit target (this is for a buy order). Do the exact opposite for sell order: move stop loss for each lower peak that forms until take profit is hit.


Pros :

  • Profits come faster if breakout is caught at the right time thus the symmetrical chart pattern is a very explosive breakout chart pattern.
  • No indicator is needed
  • Very easy to follow
  • Can be used in Any time frames as The symmetrical chart pattern happens in all time frames, so regardless of what time frames are trading, they do happen frequently especially in the much smaller time frames like the 1 min to the 30 minute time frames.


Cons :

  • False breakouts are possible .
  • There is always a chance that price moves sideways for an extended period of time or even moves higher.

Brexit optimism favors Pound

Markets are rising and the safe-haven dollar is down on hopes that President Trump may leave the hospital shortly.  President Donald Trump’s doctors said on Sunday that President Donald Trump’s  Commander-In-Chief is improving.

But the Doctors not involved in Trump’s treatment said they suspected his condition might be worse than Conley let on. As an overweight, elderly man, Trump is in a category that is more likely to develop severe complications from the disease. Trump has consistently downplayed the risks of the pandemic since it first emerged this year, and he has repeatedly flouted social-distancing guidelines meant to curb its spread.

At Walter Reed, Trump mounted a brief motorcade to wave to supporters gathered outside the hospital on Sunday. He also said he had been meeting with soldiers and first responders – drawing criticism that he might be exposing more Americans to infection. He was diagnosed with the disease shortly after appearing at a New Jersey fundraiser on Thursday.

Biden, 77, has tested negative for the disease several times since sharing a debate stage with Trump last Tuesday. He is due to resume in-person campaigning on Monday in Florida, where opinion polls show a tight race in a crucial battleground for the Nov. 3 election.

Trump also is pushing to install federal judge Amy Coney Barrett on the Supreme Court, which would lock in a conservative majority on the nation’s highest court for years to come. Several people present at the Sept. 26 White House ceremony where Trump nominated Barrett have tested positive for COVID-19 – including two Republican senators whose votes will be needed to confirm her to the high court.

On the other hand, there will no extension of the Brexit transition period beyond December 31, 2020, meaning that the European Union and the UK will have to strike a deal in just six months to avoid Britain crashing out of the bloc without one. Under the agreement of the deal, the UK had until June to extend the transition period.

The EU and UK supported plans “to intensify the talks in July and to create the most conducive conditions for concluding and ratifying a deal before the end of 2020,” leaders said in a statement.

GBP/USD 4 Hour Chart:

Support: 1.2865 (S1), 1.2793 (S2), 1.2748 (S3).

Resistance: 1.2982 (R1), 1.3026 (R2), 1.3098 (R3).

The Brexit optimism drives the market as of now. We expect a bullish trend for the Cable (GBP/USD).

XAU/USD Weekly Forecast (5th October 2020 – 9th October 2020)

Fundamental view:

Investors once again believe gold is a safe-haven trade.  Overnight, gold prices surged after President Donald Trump and first lady Melania Trump tested positive for coronavirus.  After a steady rally this week, gold is now comfortably above the $1,900 level. 

There is a lot of confusion in the marketplace after positive test of President Donald Trump and first lady Melania Trump for coronavirus. Still, analysts remain bullish on gold next week, aside from a few caveats to watch out for.      

The major economic events deciding the movement of the pair in the next week are ISM Non-Manufacturing PMI at Oct 05, JOLTS Job Openings, Fed Chair Powell Speech at Oct 06, EIA Crude Oil Stocks Change at Oct 07, and Initial Jobless Claims at Oct 08 for US.

XAU/USD Weekly outlook:

Technical View:

Last week’s high was 1.97% lower than the previous week. Maintaining high at 1917.1 and low at 1848.9 showed a movement of 681 pips.

In the upcoming week we expect XAU/USD to show a bullish trend.  The Instrument is trading above the 50 Simple Moving Average and the MACD trades to the upside. A solid breakout above 1930.5 may open a clean path towards 1957.9 and may take a way up to 1998.7. Should 1862.4 prove to be unreliable support, the XAUUSD may sink downwards 1821.6 and 1794.2 respectively. In H4 chart W-pattern breakout favors prospects of a bullish trend. Also to be noted Bullish engulfing formation exerts the expectation of uptrend for the pair.

Preference
Buy: 1901.9 target at 1956.5 and stop loss at 1858.4


Alternate Scenario
Sell:  1858.4 target at 1804.7 and stop loss at 1901.9