AUD/USD Weekly Forecast (5th October 2020 – 9th October 2020)

Fundamental view:

The AUD/USD pair has recovered some ground these days, as the greenback remained out of the market’s favor. Little of interest happened in Australia last week. The most encouraging news came from the coronavirus front, as the country seems to have controlled the latest outbreak, reporting on average 20 new cases per day this week. 

Crude Oil Inventories on 30th Sept, Unemployment Claims monthly report on 1st Oct created a bearish trend for the pair whereas Japan Tankan Manufacturing Index on 1st Oct and US Unemployment Rate on 2nd Oct created a bullish trend for the pair.

The major economic events deciding the movement of the pair in the next week are US ISM Non-Manufacturing PMI at Oct 05, RBA Interest Rate Decision, Fed Chair Powell Speech at Oct 06, EIA Crude Oil Stocks Change at Oct 07, US Initial Jobless Claims at Oct 08, and RBA Financial Stability Review at Oct 09.

AUD/USD Weekly outlook:

Technical View:

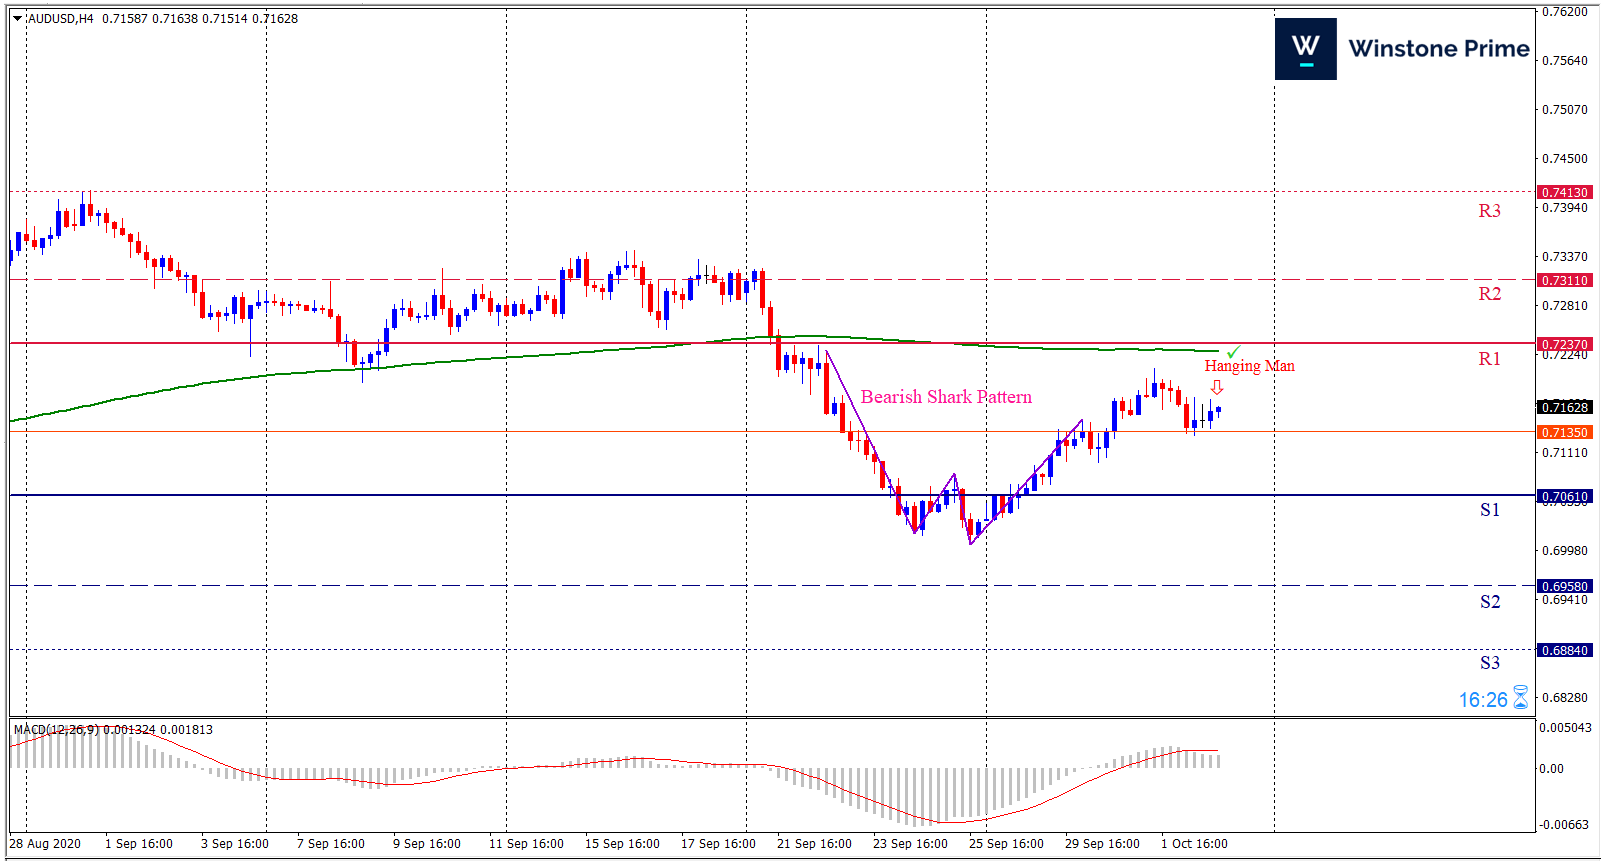
Last week’s high was 1.57% lower than the previous week. Maintaining high at 0.7209 and low at 0.7032 showed a movement of 176 pips.

In the upcoming week we expect AUD/USD to show a bearish trend.  The currency pair is trading below the 200 Simple Moving Average and the MACD trades to the downside. A solid breakout below 0.7061 may open a clean path towards 0.6958 and may take a way down to 0.6884. Should 0.7237 prove to be unreliable resistance, the AUDUSD may raise upwards 0.7311 and 0.7413 respectively. In H4 chart bearish butterfly pattern favors prospects of a bearish trend. Also to be noted hanging man candle formation exerts the expectation of downtrend for the pair.

Preference
Sell: 0.7164 target at 0.7014 and stop loss at 0.7242


Alternate Scenario
Buy:  0.7242 target at 0.7412 and stop loss at 0.7164

Profit targets and place it like a professional

Profit targets are the most important part of your trading. A profit target is a predetermined point at which an investor will exit a trade in a profitable position. It requires you work out in advance exactly how much risk you are prepared to take for how much potential reward.

In this article we are going to take look about trading psychology of  profit targets and how to place it correctly.

The concept behind profit targets

Profit targets are not your entries where you make a profit or loss, it’s your exits. It’s a part of many trading strategies that investors and technical traders use to manage risk. Profit targets can be determined at various points of an investment. Investors can initiate conditional orders to achieve their profit target. It can be a good way to manage the risk of high risk investments. Choosing a profit target is a key part of your trading strategy, it requires you work out in advance exactly how much risk you are prepared to take for how much potential reward.

Targets can be placed in different ways. The most popular method involves identifying support and resistance levels and placing a profit target at the resistance value and a stop-loss order just below the support value.

Support and resistance levels can be identified in a rudimentary way by placing a trendline across the peaks and dips on your price action graph where price reverses in the opposite direction.

It’s also possible to establish support and resistance levels and place profit targets using a pivot point analysis. A pivot point takes the average high and low closing prices from the previous day and uses them to establish a current trading range—that is, support and resistance levels. In a strong trend, price will continue to break its previous resistance threshold, creating a stair-like pattern as illustrated.

By placing your profit target at the established resistance level, you’ll lock in profits each time price breaks this range, thereby continuing the trend. Using the width of the current support and resistance range as a guide, traders also attempt to predict secondary support and resistance levels at which to place new profit targets and stop-loss orders.

It’s also possible to place profit targets using the average true range (ATR), an indicator that measures price volatility. ATR values reflect the average change in price that a currency pair experiences in a single day. By adding the ATR value to the current market price, you can set a realistic profit target for the upcoming day.

Although support and resistance levels, pivot points, and the ATR can all help you determine profit targets, it’s important to remember that these are just estimates. In order to place them more effectively, you must understand the market and be able to recognize the strength and direction of the current trend to identify when a reversal may be imminent.

Looking at the same AUDUSD 4hour chart, we can see how taking partial profits would have worked marvelously in this trade example. Since this is a long trade example, resistance levels should be used as targets. For short trades, of course, support levels should be used as targets.

Profit Targets are set at each resistance level from the previous chart. You can see how, at some points on the chart, the horizontal resistance is at confluence with the channel resistance. These are excellent points to lock in partial profits.

Partial profits are a great tactic because they let us capture maximum profits during long trends while making profits and reducing the risk at the same time. We can see that the 3rd target was not reached and the price instead fell through the support trendline. Nevertheless, all three parts of the position were profitable in the end.

Another effective technique for taking profits is the “trailing stop”. This is a strategy best used during strong market trends or if you are a trend trader. The trailing stop trails the price with a fixed Stop-Loss size. So, for example, if you set the trailing stop at 50 pips, it will trail the price at a fixed distance of 50 pips and as the trade moves into profit more and more so does the Stop-Loss by the same amount.

By this example, if the trade moves 200 pips in your favor your trailing stop will trail the trade at 50 pips – locking in a nice 150 pips profit. At the point when the price moves 50 pips against your direction, the trade will be closed. The main disadvantage with this strategy is that it’s lagging and it tends to give away a sufficient amount of profits. Some traders don’t like this and they prefer to use a leading indicator to place profit targets, like Fibonacci projections or pivot points.

Still, at the true mastery level, it is possible to combine the two and use the trailing stop as protection until the final target is hit at which point the position is closed without waiting for the trailing stop to be hit.

Once you fully understand the fact that each trade has a completely random outcome and that we can’t control the market in any way, you’ll find it easier to accept losses and will not have any expectations concerning the trade’s outcome. Once you completely embrace this fact, you’ll feel immediate relief and you’ll stop chasing the market for winning trades.

Take a look at the chart above. The price reaches close to a resistance line, giving two possible outcomes to the trade: the price will either break the resistance line and go up, or retest the resistance and go down. If your trading strategy is well-rounded and combines fundamentals with technical’s, you may have a slight edge in predicting what the market will do next.  Whether or not one single trade is profitable or not it’s not in your hands. You only know that, after a series of trades using a high-probability strategy, you should eventually make a profit. Casinos have a similar approach. They know that the house always wins in the end after hundreds or thousands of games, but don’t know if a single roulette game will be a winner or loser for them.

When you enter a trade, you need to be aware that its outcome is almost completely random. Even the best professional traders at investment banks have a winning rate of slightly over 50%. This means that we can’t control the outcome of a single trade; it has an equal probability of being a winner and a loser. Although every single trade has a random outcome, traders can gain an edge with a large enough sample size by taking high-probability trades and utilizing strict risk management rules. Although markets do show signs of predictable behavior by forming downtrends, uptrends, and certain price patterns, it’s crucially important for traders to understand that each trade’s outcome on its own is a random, uncertain event.

Conclusion

In this article you have learned about a profit target is a price level on a chart that you set to take your profit. Choosing a profit target requires you to work out in advance exactly how much risk you are prepared to take for how much potential reward and there are countless ways in which you can set your profit target using technical indicators and other tools – two of the most popular are support and resistance, and taking partial profits.

Human psychology pushes us to be right about any decision we make. The same applies to trading. Traders try to get all trading decisions correct, and get upset once a “perfect” trade setup becomes a loser. In closing, trading is not about ‘getting it right’ all the time. However, the markets don’t function that way and there is no sense in chasing the market.

However, it’s consistency, risk management, risk-to-reward ratios, and being very patient about losing trades that brings in profits over a large sample size of trades. The professional traders understand that they can’t control the market in any way. Even professional traders have a win rate closer to 50% than you think, meaning that winners and losers are almost equally distributed.

Happy trading!!

US President Tests positive for corona

The October month shock is here – US President Donald Trump and the first lady tested positive for corona virus Thursday. Trump tweeted that he and his wife Melania would begin their “recovery process immediately” and “get through this together.”

Minutes after Trump tweeted his positive test result, the White House physician said the president was “well” and would continue to perform his duties “without disruption” while quarantining along with the first lady. Dr Sean Conley said the pair plans to “remain home at the White House during their convalescence.”

The president becomes the highest-profile world leader to contract the virus, just a month before he seeks a second term in the White House. The diagnosis has thrown his reelection plan into turmoil. Immediately, the White House canceled plans for Trump to attend a campaign fundraiser and to fly to Florida for a rally later Friday. However, the first lady’s chief of staff wrote on Twitter that “nothing” would stop the pair from “fighting for the American people.”

On the other hand, First-time claims for unemployment insurance totaled 837,000 last week, the Labor Department said Thursday as the jobs market continues its plodding recovery from the corona virus pandemic. Economists surveyed by Dow Jones had been expecting 850,000. The weekly total represented a decline of 36,000 from the previous week’s upwardly revised 870,000, according to seasonally adjusted numbers.

This was the fifth consecutive week that claims were under 1 million after staying there for five months following the COVID-19-related economic shutdown in mid-March. However, the total is still well above anything the U.S. has seen since before the crisis. Continuing claims provided some better news, with those collecting benefits for at least two weeks falling by 980,000 to 11.77 million.

USD/CHF 4 Hour Chart:

Support: 0.9162 (S1), 0.9138 (S2), 0.9112 (S3).

Resistance: 0.9212 (R1), 0.9238 (R2), 0.9262 (R3).

In the prevailing market sentiment which risk-prone for dollar as US president and first lady tested positive for the virus, we expect a bearish trend for USD/CHF.

Japan’s Manufacturing PMI supports yen

According to Japan’s Manufacturing PMI, September data indicated that the Japanese manufacturing sector moved another step closer to stabilization, helped by the slowest fall in new orders since January. At the same time, hopes of a longer-term recovery in production volumes strengthened, with growth expectations for the year ahead rising to the highest since May 2018.

Supporting the rise in the PMI during September, the latest data indicated the weakest decline in production volumes for seven months. Manufacturers reporting a drop in output mostly commented on project cancellations and subdued demand levels due to the coronavirus disease 2019 (COVID-19) pandemic. However, the latest decrease in production was modest in comparison to the rate of contraction seen during the second quarter of the year.

Nikkei came out with the news suggesting the government’s readiness for further stimulus. It should also be noted that Japanese Prime Minister Suga recently turned down calls for a snap election and triggered skepticism as the politician earlier cheered this idea.

On the other hand, The US 10-year breakeven rate, a bond market’s measure of expected inflation derived from 10-Year Treasury Constant Maturity Securities and 10-Year Treasury Inflation-Indexed Constant Maturity Securities, fell from 1.76% to 1.63% in September. The market-based measures of long-term price pressures declined even as the Federal Reserve adopted a more flexible approach to controlling inflation at the end of August.

US policymakers are inching closer to the much-awaited stimulus despite failing to agree on Wednesday. The American Congress even passed a stopgap funding bill to let the government work after the previous deadline expired on September 30. Further, the coronavirus (COVID-19) risk pushes the UK towards national lockdown amid a lack of major progress at the vaccine front.

USD/JPY 4 Hour Chart:

Support: 105.32 (S1), 105.16 (S2), 104.92 (S3).

Resistance: 105.72 (R1), 105.96 (R2), 106.12 (R3).

With a lack of major catalysts, USD/JPY traders will keep eyes on the US session that carries the weekly Jobless Claims and the September month ISM Manufacturing PMI. We expect a bearish trend for the pair till the next US news changes the market tone.