USD/JPY Weekly Forecast (28th September 2020 – 2nd October 2020)

Fundamental view:

The US dollar initially fell a bit during the week, but then turned around to break above the resistance of 105.70. Britain CBI Industrial Order Expectations on 22nd Sept and US HPI monthly report on 23rd Sept created upward movement for the pair whereas Britain CBI Realized Sales on 24th Sept and Britain GfK Consumer Confidence on 25th Sept created downward movement for the pair.

At this point, the market is likely to see continued upward pressure due to the strength of dollar, at least in the short term.

The major economic events deciding the movement of the pair in the next week are Japan Retail Sales monthly report, US CB Consumer Confidence Index at Sep 29, BoJ Tankan Large Manufacturing Index, US GDP quarterly report at 30 Sep, US ISM Manufacturing PMI at Oct 01, and US Nonfarm Payrolls at Oct 02.

USD/JPY Weekly outlook:

Technical View:

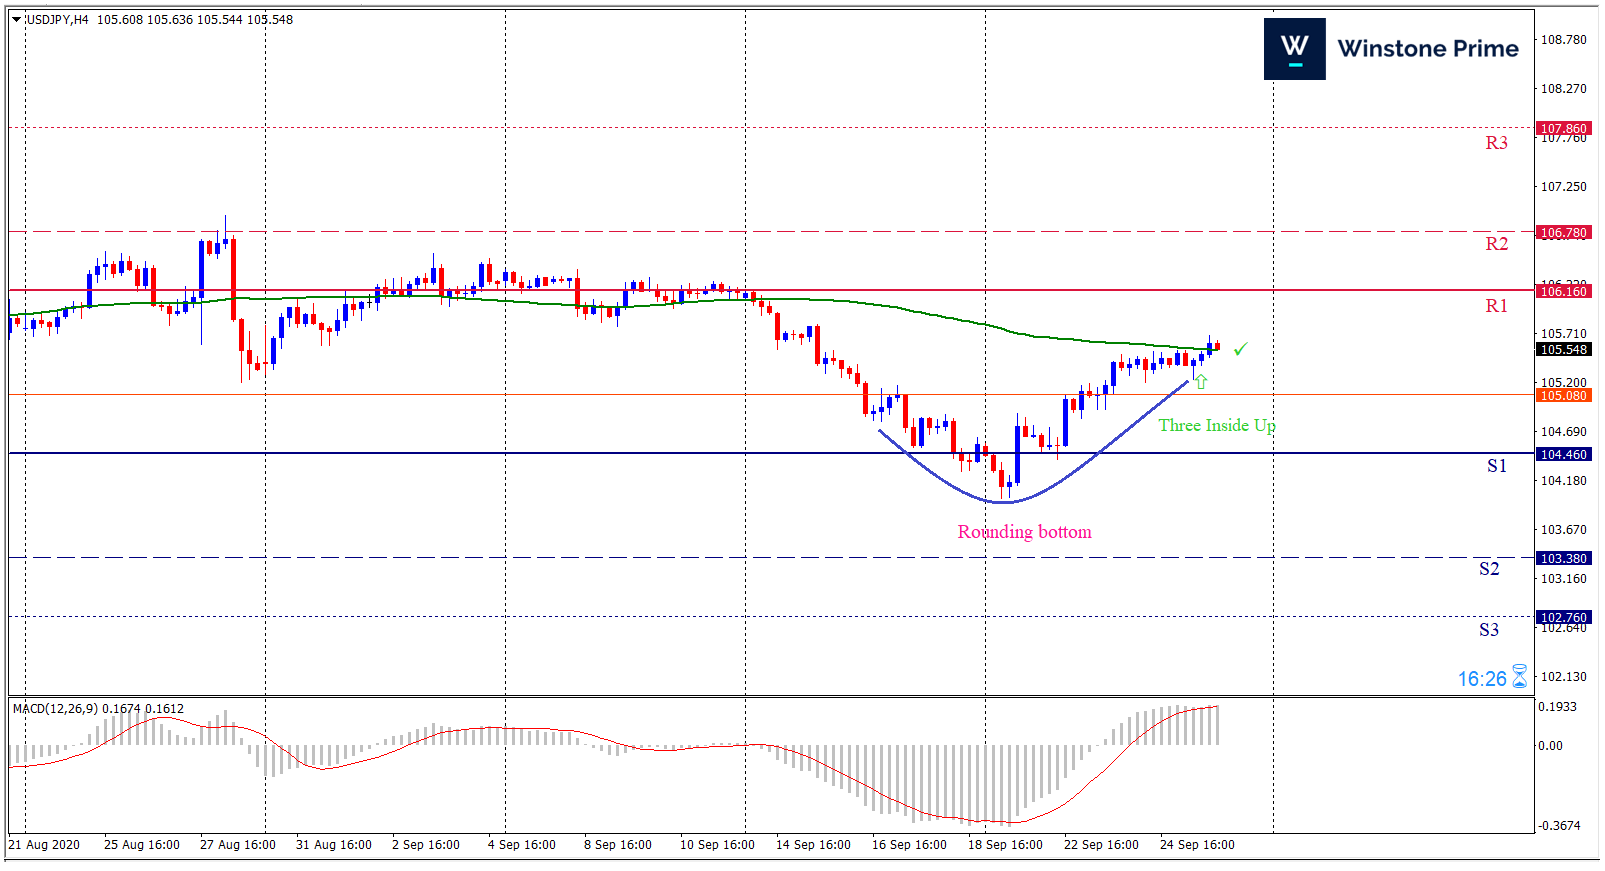
Last week’s high was 0.44% lower than the previous week. Maintaining high at 105.70 and low at 104.00 showed a movement of 170 pips.

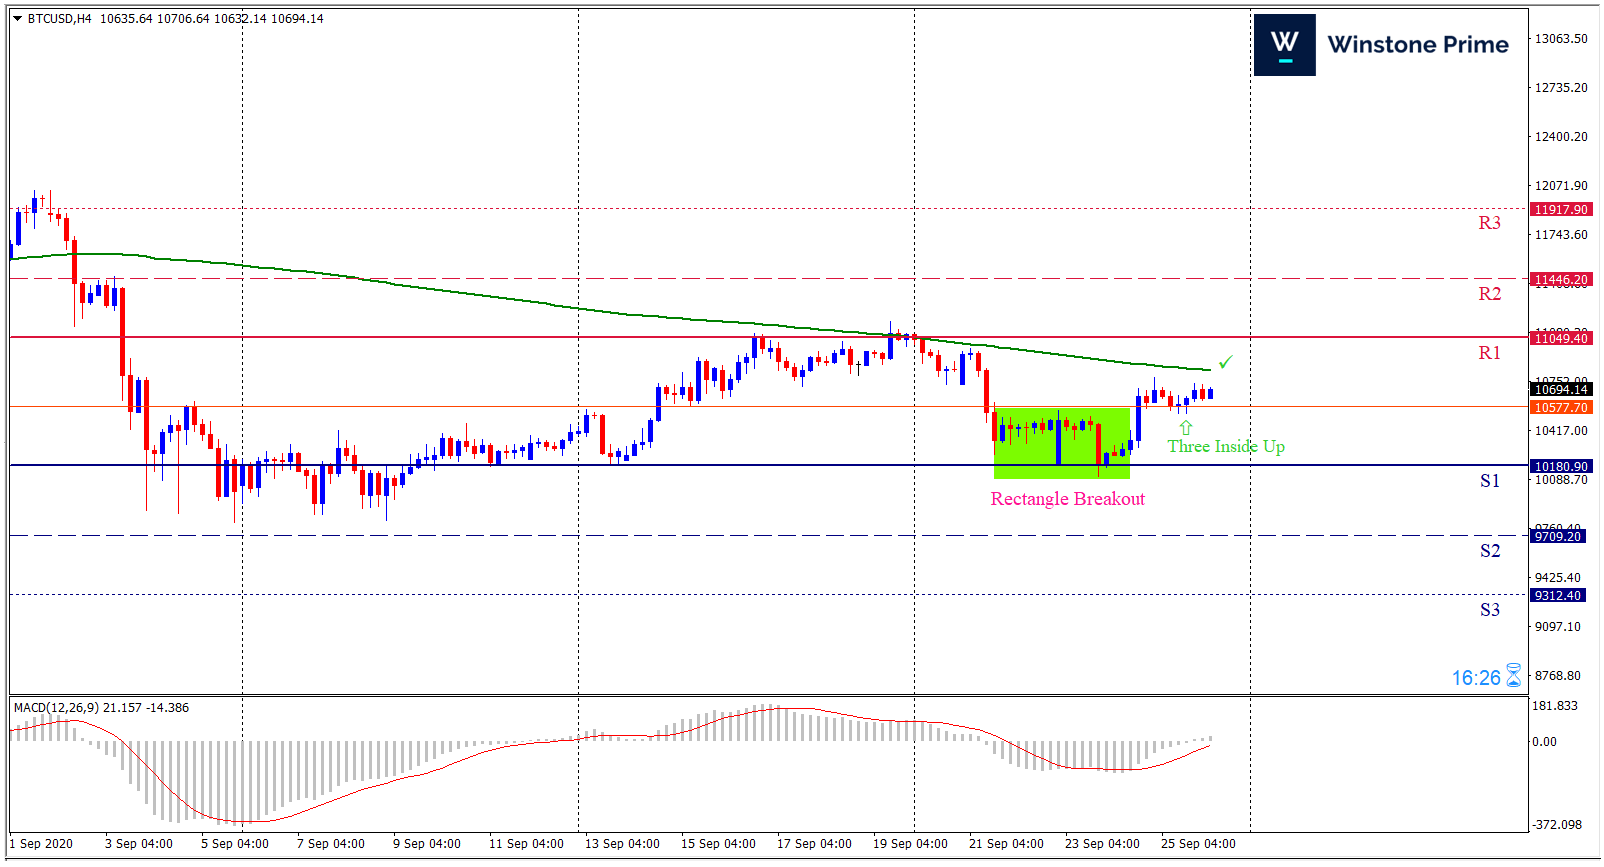
In the upcoming week we expect USD/JPY to show a bullish trend. The currency pair is trading above the 100 Simple Moving Average and the MACD trades to the upside. A solid breakout above 106.16 may open a clean path towards 106.78 and may take a way up to 107.86. Should 104.46 prove to be unreliable support, the USDJPY may sink downwards 103.38 and 102.76 respectively. In H4 chart, Formation of rounding bottom indicates prospects of a bullish trend Along with a bullish three inside up candle formation braces our expectation.

Preference
Buy: 105.50 target at 106.77 and stop loss at 104.41


Alternate Scenario
Sell:  104.41 target at 102.77 and stop loss at 105.50

BTC/USD Weekly Forecast (28th September 2020 – 2nd October 2020)

Fundamental view:

Bitcoin fell in the last week initially due to the positive sentiment for the greenback but managed to bounce back in the coming days until it fell in the last day of the week.

According to a study by researchers at the Cambridge Centre for Alternative Finance, the number of people who own Bitcoin (BTC) and other digital assets has surged from about 35 million in 2018 to over 100 million. This is a positive sign because the growth continued. And in the upcoming week we expect a bullish trend for the pair. 

The major economic events deciding the movement of the pair in the next week are CB Consumer Confidence Index at Sep 29, ADP Nonfarm Employment Change, GDP quarterly report, EIA Crude Oil Stocks Change at 30 Sep, ISM Manufacturing PMI at Oct 01, and Nonfarm Payrolls at Oct 02 for US.

BTC/USD Weekly outlook:

Technical View:

Last week’s high was 1.63% lower than the previous week. Maintaining high at 10974.5 and low at 10106.0 showed a movement of 868 pips.

In the upcoming week we expect BTC/USD to show a bullish trend. The Instrument is trading below the 200 Simple Moving Average and the MACD trades to the upside. A solid breakout above 11049.4 may open a clean path towards 11446.2 and may take a way up to 11917.9. Should 10180.9 prove to be unreliable support, the BTCUSD may sink downwards 9709.2 and 9312.4 respectively. In H4 chart rectangle breakout favors prospects of a bullish trend. Three inside up candle formation constructs a bullish outlook for the pair in the upcoming week.

Preference
Buy: 10625.5 target at 11441.9 and stop loss at 10175.2


Alternate Scenario
Sell: 10175.2 target at 9313.5 and stop loss at 10625.5

Bear Trap Trading Strategy

Based on a price pattern, the bear trap trading strategy is a price action trading strategy. Bear trap chart patterns are bullish patterns, that means on seeing it, we should only be looking to buy.

We need

  • The ability to spot or identify major support levels.
  • The ability to do multiple timeframe trading.
  • The ability to identify bullish reversal candlesticks.


Timeframes : 15 Minutes and above

Instrument : All

Indicators : None

Bear Trap Trading Strategy Rules :

Here are the trading rules of the bear trap trading system and they are really simple if we know how to identify the different types of bear trap chart patterns.

  • Wait for the bullish candlestick signal, once a bear trap chart pattern forms. Bear Trap chart pattern is the chart pattern formed in the bearish trend hits the support line and bullish candlestick is immediately formed after that.
  • After that bullish candlestick signal forms, place a buy stop pending order at least 2 pips above the high of that bullish candlestick.
  • Place stop loss at least 2 pips below the low of that bullish candlestick or place it 2 pips below the low of the bear trap candlestick.
  • Set Take profit at risk: reward of 1:3 minimum or use the previous swing high as “take profit target”.


Let us explain with a chart below :

Pros :

  • Powerful price action trading system especially when price tends to move up explosively and  a bear trap pattern forms as anticipated.
  • Good risk reward ratio.
  • Simple to follow.


Cons :

  • Rare to happen as not all support levels will produce bear traps.
  • Sometimes bear trap might not be a bear trap at all and price will continue to fall regardless. So expect that trading loses do happen and no trading system is the holy grail as all strategies has their limitation.

Europe decides to regulate cryptocurrency

A much anticipated first-ever plan to regulate cryptocurrency in Europe was unveiled on Thursday by the European Commission. The executive branch of the European Union (EU), the agency responsible for managing the day-to-day business of the 27-nation bloc, proposed legislation crafted to reduce risks for investors, while also giving legal certainty to companies issuing them.

“The future of finance is digital,” said Valdis Dombrovskis, the panel’s executive vice president, in a statement. “During the lock-down, many people shifted to accessing banking and other financial services online. Many more made contactless payments. Developing better financial products for consumers and opening new funding channels for companies will all help the recovery.”

The legislation is intended to reduce market fragmentation, as many digital finance providers only operate in one country. As a result, the measure allows crypto companies to provide its services across the other member states with approvals. Still, Dombrovskis noted that digital transformation is not risk-free. The new legislation intends to reduce these risks for investors, while also giving legal certainty to the issuers of cryptocurrency.

And the new update that The European Commission will launch a new effort in the next few days to boost its own capital markets boosted EUR. It is a project which has become wrapped up in the EU’s push for greater “strategic autonomy” given the vulnerabilities exposed by the Covid-19 pandemic and the great power rivalry between the US and China.

The deteriorating state of relations with the UK in recent weeks has only strengthened the argument for the EU to stand on its own two feet, officials say.

On the other hand, the investment banking giant Goldman Sachs foresees Washington’s stalemate on additional fiscal stimulus leading to a slower than expected US economic growth in the fourth quarter.

Economists have lowered their fourth-quarter gross domestic product forecast to 3% from 6% on a quarter-on-quarter basis after revising its base case to include a lack of additional fiscal stimulus until 2021, according to Business Insider.

EUR/USD 4 Hour Chart:

Support: 1.1636 (S1), 1.1601 (S2), 1.1575 (S3).

Resistance: 1.1696 (R1), 1.1722 (R2), 1.1757 (R3).

Amidst all the catalysts favoring EUR against Greenback, we expect a bullish trend for EUR/USD.