USD/JPY Weekly Forecast (21st September 2020 – 25th September 2020)

Fundamental view:

Japan installed a new prime minister and the Federal Reserve stretched its zero rate prediction to the end of 2023 which made the pair to rally downwards in the last week. Japan Revised Industrial Production on 14th September, Japan Trade Balance on 16th September and Building Permits on 17th September created downtrend for the pair whereas US Business Inventories m/m, Crude Oil Inventories on 16th September and US Prelim UoM Consumer Sentiment on 18th September created uptrend for the pair.

US dollar has started to show signs of strength against other currencies and we expect an uptrend of the pair in the upcoming week.

The major economic events deciding the movement of the pair in the next week are Fed Chair Powell Testimony at Sep 22, BoJ Monetary Policy Meeting Minutes, Japan Markit Manufacturing PMI at Sep 23, US Markit Manufacturing PMI, EIA Crude Oil Stocks Change at Sep 23, and US Core Durable Goods Orders monthly report at Sep 25.

USD/JPY Weekly outlook:

Technical View:

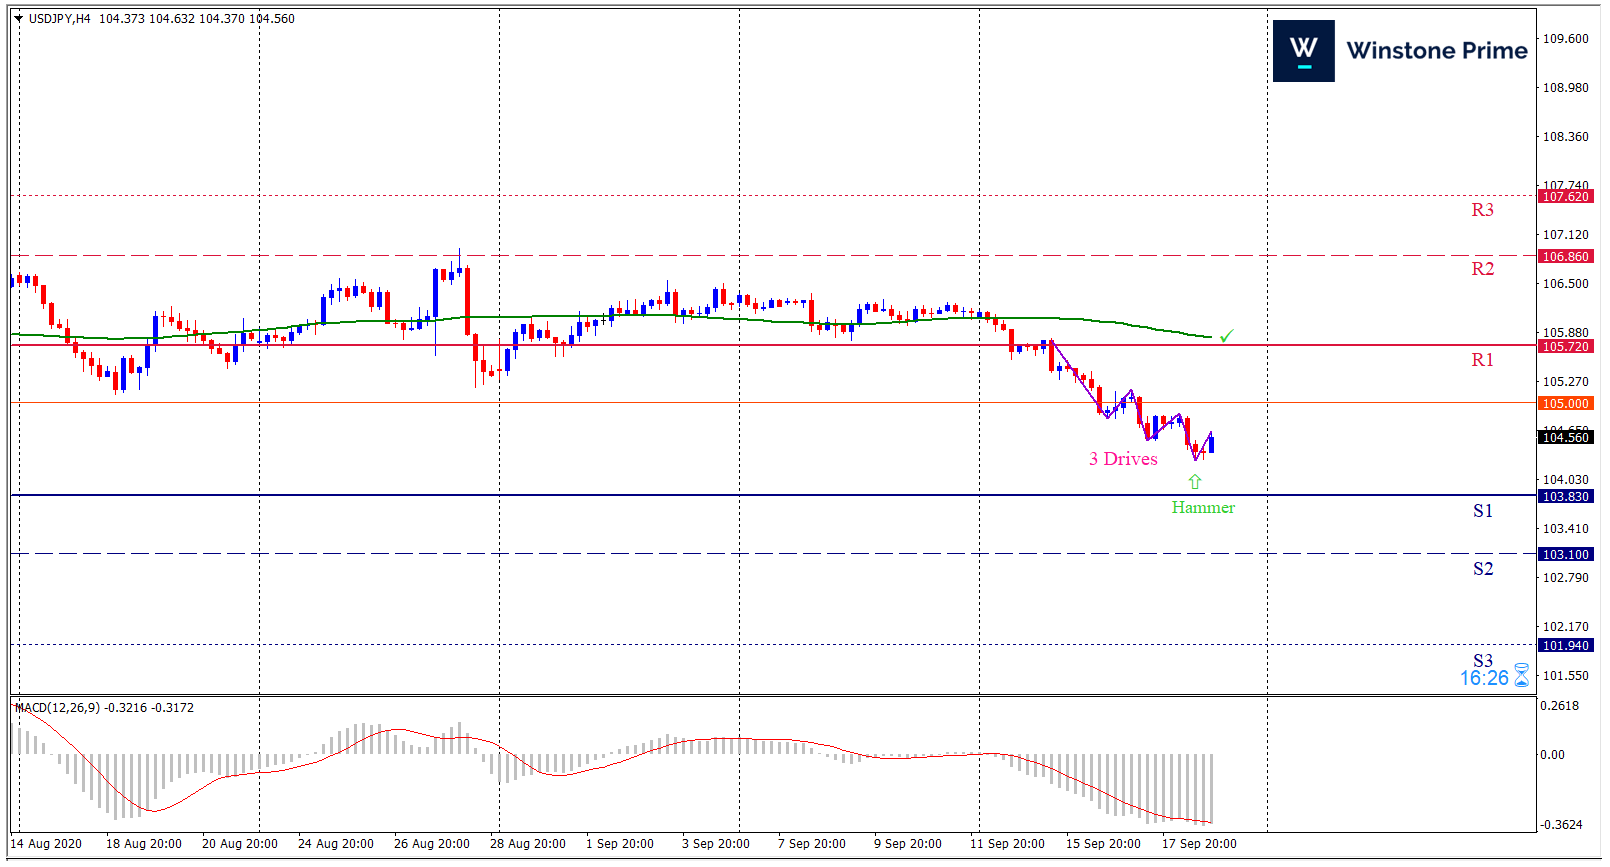
Last week’s high was 0.21% lower than the previous week. Maintaining high at 106.16 and low at 104.27 showed a movement of 189 pips.

In the upcoming week we expect USD/JPY to show a bullish trend. The currency pair is trading below the 100 Simple Moving Average and the MACD trades to the upside. A solid breakout above 105.72 may open a clean path towards 106.89 and may take a way up to 107.62. Should 103.83 prove to be unreliable support, the USDJPY may sink downwards 103.10 and 101.94 respectively. In H4 chart, Formation of bullish 3 drives pattern indicates reversal of the trend creating prospects of a bullish trend Along with a bullish hammer formation braces our expectation.

Preference
Buy: 104.29 target at 106.05 and stop loss at 103.05


Alternate Scenario
Sell:  103.05 target at 101.51 and stop loss at 104.46

XAU/USD Weekly Forecast (21st September 2020 – 25th September 2020)

Fundamental view:

Gold has been consolidating heavily over the last month and this week’s Fed meeting did not inspire a breakout in either direction. “Barring short-term corrections, negative real yields and a weaker dollar, alongside the unprecedented stimulus, create a favourable macro environment for gold and are likely to be the key price drivers over the coming months.” The instrument has showed a mixed trend in the last week.          

The major economic events deciding the movement of the pair in the next week are Existing Home Sales, Fed Chair Powell Testimony at Sep 22, Markit Manufacturing PMI, EIA Crude Oil Stocks Change at Sep 23, New Home Sales at Sep 24, and Core Durable Goods Orders monthly report at Sep 25 for US. 

XAU/USD Weekly outlook:

Technical View:

Last week’s high was 0.36% higher than the previous week. Maintaining high at 1973.5 and low at 1932.8 showed a movement of 407 pips.

In the upcoming week we expect XAU/USD to show a bullish trend.  The Instrument is trading above the 100 Simple Moving Average and the MACD trades to the upside. A solid breakout above 1972.3 may open a clean path towards 1993.2 and may take a way up to 2013.0. Should 1931.6 prove to be unreliable support, the XAUUSD may sink downwards 1911.9 and 1890.9 respectively. In H4 chart bullish bat pattern favors prospects of a bullish trend. Also to be noted bullish shooting star formation exerts the expectation of uptrend for the pair.

Preference
Sell:  1951.4 target at 1992.2 and stop loss at 1925.5


Alternate Scenario
Buy: 1925.5 target at 1889.9 and stop loss at 1951.4

EUR/USD Weekly Forecast (21th September 2020 – 25th September 2020)

Fundamental view:

The Euro went back and forth during the course of the week, showing signs of indecision. Several central banks had monetary policy meetings these days, the US Federal Reserve included but were far from being shining stars. In fact, the impact of the pandemic on economies, and the uncertainty on what’s to come in that front, have policymakers as clueless as speculators. Europe Industrial Production on 14th September, German ZEW Economic Sentiment on 15th September and Europe Trade Balance on 16th September created uptrend for the pair whereas US Empire State Manufacturing Index, Import Prices on 15th September and US Core Retail Sales on 16th September created downtrend for the pair.

US dollar looks likely to find some buying, based upon the US Dollar Index and we expect a bearish trend in the upcoming week.

The major economic events deciding the movement of the pair in the next week are Fed Chair Powell Testimony at Sep 22, Euro Markit Manufacturing PMI, US Markit Manufacturing PMI, EIA Crude Oil Stocks Change at Sep 23, EU Leaders Summit at Sep 24, and US Core Durable Goods Orders monthly report at Sep 25.  

EUR/USD Weekly outlook:

Technical View:

Last week’s high was 0.14% lower than the previous week. Maintaining high at 1.1900 and low at 1.1737 showed a movement of 163 pips.

In the upcoming week we expect EUR/USD to show a bearish trend. The currency pair is trading above the 200 Simple Moving Average and the MACD trades to the upside. A solid breakout below 1.1752 may open a clean path towards 1.1663 and may take a way down to 1.1590.  Should 1.1915 prove to be unreliable resistance, the EURUSD may raise upwards 1.1989 and 1.2078 respectively. Breakout of a symmetrical triangle pattern in H4 chart sets prospects for a bearish trend. Bearish harami formation in H4 chart escalates the expectation for a bearish trend.

Preference
Sell: 1.1874 target at 1.1719 and stop loss at 1.1942


Alternate Scenario
Buy:  1.1942 target at 1.2077 and stop loss at 1.1874

GBP/USD Weekly Forecast (21th September 2020 – 25th September 2020)

Fundamental view:

The British pound has rallied significantly during the course of the week, reaching towards the 1.30 level above. That is a large, round, psychologically significant figure and of course that is something that will catch a lot of attention. Britain Claimant Count Change, Average Earnings Index on 15th September, US TIC Long-Term Purchases on 17th September and US Unemployment on 17th September favors uptrend for the pair whereas  US Empire State Manufacturing on 15th September and Britain PPI Input and PPI output monthly report on 16th Septembers favors downtrend for the pair.

The major economic events deciding the movement of the pair in the next week are BoE Governor Bailey Speech, Fed Chair Powell Testimony at Sep 22, UK Markit/CIPS Manufacturing PMI, US Markit Manufacturing PMI, EIA Crude Oil Stocks Change at Sep 23, and US Core Durable Goods Orders monthly report at Sep 25.  

GBP/USD Weekly outlook:

Technical View:

Last week’s high was 1.90% lower than the previous week. Maintaining high at 1.3007 and low at 1.2788 showed a movement of 219 pips.

In the upcoming week we expect GBP/USD to show a bearish trend.  The currency pair is trading below the 200 Simple Moving Average and the MACD trades to the downside. A solid breakout below 1.2805 may open a clean path towards 1.2687 and may take a way down to 1.2586. Should 1.3023 prove to be unreliable resistance, the GBPUSD may raise upwards 1.3125 and 1.3242 respectively. Chart formation of bearish gartley pattern in H4 chart favors prospects of a bearish trend. Three inside down pattern formation escalates the expectation for a bearish trend.

Preference
Sell: 1.2968 target at 1.2785 and stop loss at 1.3027


Alternate Scenario
Buy:  1.3027 target at 1.3141 and stop loss at 1.2968