BTC/USD Weekly Forecast (21th September 2020 – 25th September 2020)

Fundamental view:

This week was nothing short of exciting. Bitcoin started trading at around $10,300 but was on a positive note throughout the entire time. It increased gradually, without any sharp and somewhat surprising movements, and managed to add about 6.5% to its value.

Bitcoin showed a mixed trend in the last week. Jack Dorsey, the CEO of Twitter and Square, said that Bitcoin is “probably the best” native currency of the Internet as it is consensus-driven and “built by everyone.” 

The major economic events deciding the movement of the pair in the next week are Existing Home Sales, Fed Chair Powell Testimony at Sep 22, Markit Manufacturing PMI, EIA Crude Oil Stocks Change at Sep 23, New Home Sales at Sep 24, and Core Durable Goods Orders monthly report at Sep 25 for US.  

BTC/USD Weekly outlook:

Technical View:

Last week’s high was 4.89% higher than the previous week. Maintaining high at 11076.0 and low at 10217.5 showed a movement of 858 pips.

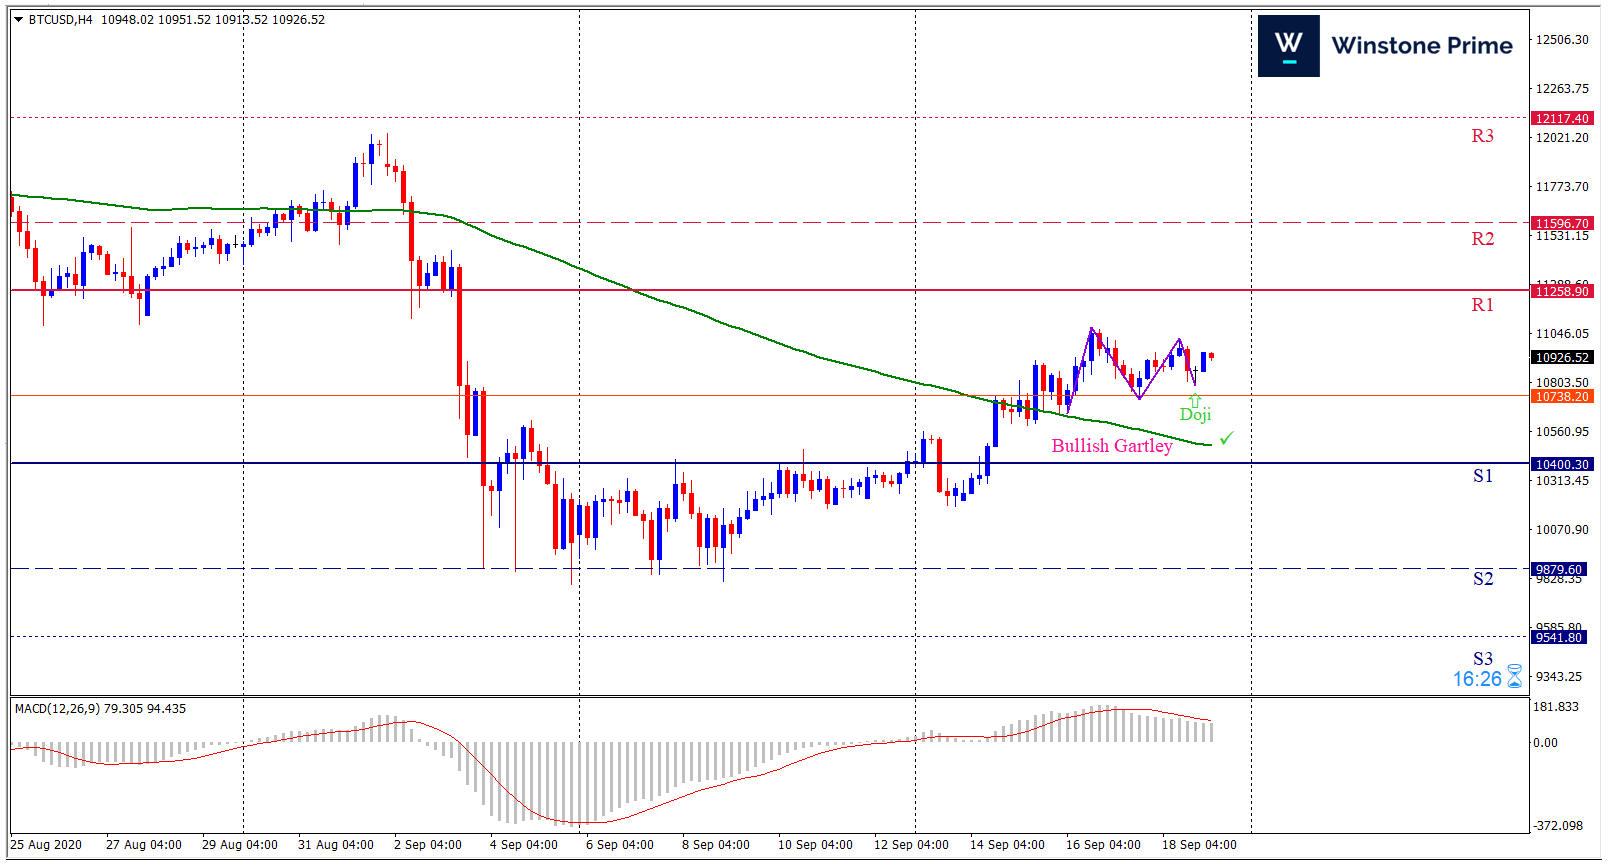
In the upcoming week we expect BTC/USD to show a bullish trend. The Instrument is trading above the 100 Simple Moving Average and the MACD trades to the upside. A solid breakout above 11258.9 may open a clean path towards 11596.7 and may take a way up to 12117.4. Should 10400.3 prove to be unreliable support, the BTCUSD may sink downwards 9879.6 and 9541.8 respectively. In H4 chart bullish gartley breakout favors prospects of a bullish trend. Doji candle pattern constructs a bullish outlook for the pair in the upcoming week.

Preference
Buy: 11036.2 target at 11833.9 and stop loss at 10395.7


Alternate Scenario
Sell: 10395.7 target at 9545.9 and stop loss at 11036.2

AUD/USD Weekly Forecast (21th September 2020 – 25th September 2020)

Fundamental view:

The Australian dollar has gone back and forth over the last couple of weeks, and at this point in time it is likely that the market will continue to see a lot of back and forth in this general vicinity due to the fact that it has rallied. Australia Employment Change, Unemployment Rate on 17th September , US Unemployment Claims, Building Permits on 17th September created uptrend for the pair whereas US Empire State Manufacturing on 15th September and US Business Inventories on 16th September created downtrend for the pair.

The Fed’s stance after meeting earlier this month supported dollar and we expect a bearish trend for the pair in the upcoming week.

The major economic events deciding the movement of the pair in the next week are RBA Deputy Governor Debelle Speech, Fed Chair Powell Testimony at Sep 22, Australia Retail Sales monthly report, US Markit Manufacturing PMI, EIA Crude Oil Stocks Change at Sep 23, and US Core Durable Goods Orders monthly report at Sep 25.

AUD/USD Weekly outlook:

Technical View:

Last week’s high was 0.28% higher than the previous week. Maintaining high at 0.7345 and low at 0.7254 showed a movement of 91 pips.

In the upcoming week we expect AUD/USD to show a bearish trend.  The currency pair is trading above the 200 Simple Moving Average and the MACD trades to the downside. A solid breakout below 0.7246 may open a clean path towards 0.7204 and may take a way down to 0.7155. Should 0.7337 prove to be unreliable resistance, the AUDUSD may raise upwards 0.7387 and 0.7428 respectively. In H4 chart, if breakout of the expanding triangle to the downside then bearish expectation is favored. Also to be noted doji formation exerts the expectation of downtrend for the pair.

Preference
Sell: 0.7324 target at 0.7160 and stop loss at 0.7442


Alternate Scenario
Buy:  0.7442 target at 0.7562 and stop loss at 0.7324

Oil rallies failed to support Loonie long-term

The Canadian dollar dropped fast, hit support, and rebounded furiously. It was not alone. Most of the G-10 major currencies saw similar price action, which occurred following U.S. Federal Open Market Committee meeting.

The Fed left interest rates unchanged. It wasn’t a surprise. The dot-plot interest rate forecast predicted rates would remain at current levels until sometime after 2023. Analysts took note of the change in guidance in the FOMC statement.  Adding to it, , U.S. reported that Initial Jobless Claims decreased to 860,000 while Continuing Jobless Claims declined to 12.6 million. While Continuing Jobless Claims report was better than expected, the general situation in the U.S. job market remains challenging.

Canada’s ADP Employment Change report showed that private businesses slashed 205,400 jobs in August. This is the best report since the beginning of the crisis but it is clear that Canada’s job market is far from recovery.

As of 7 Wednesday, Canada had 139,747 confirmed or presumptive corona virus cases. Provinces and territories listed 122,449 of those as recovered or resolved. Ontario reported another 315 new cases of COVID-19 on Wednesday — more than half of which are in people under 40. Quebec reported 303 new cases, marking the first time since May 30 the province has had more than 300 in a day. Alberta reported 171 new cases.

The US oil, WTI, is back on the bids, underpinned by the OPEC and its allies’ (OPEC+) commitment towards the output cuts policy. The alliance said on Thursday following their meeting that they will take action on members that are not complying with deep output cuts to support the market.

The fresh uptick in oil offers support to the resource-linked Loonie, capping the recovery attempts in the major. Attention now turns towards the US UoM Consumer Sentiment data and sentiment on Wall Street for fresh trading impetus.

USD/CAD 4 Hour Chart:

Support: 1.3127 (S1), 1.3090 (S2), 1.3030 (S3).

Resistance: 1.3224 (R1), 1.3284 (R2), 1.3321 (R3).

Amidst the fact that oil rallies provided support to loonie but dollar steadiness did not allow to it to be stronger in long term. We expect a bullish trend for USD/CAD.

New Zealand’s GDP report impacts Kiwi

New Zealand’s Gross domestic product (GDP) fell by 12.2 percent in the June 2020 quarter, the largest quarterly fall recorded since the current series began in 1987, as the COVID-19 restrictions in place through the quarter impacted economic activity. “The 12.2 percent fall in quarterly GDP is by far the largest on record in New Zealand,” national accounts senior manager Paul Pascoe said.

The Reserve Bank of New Zealand had forecast a quarterly decline of 14.2% and an annual contraction of 14.4%. Growth has been hit by a standstill in economic activity as a strict nationwide corona virus lockdown in April and parts of May forced almost everyone to stay at home and businesses to shut.

The GDP data confirms New Zealand’s worst recession, defined as two straight quarters of contraction, since 2010, with GDP in the March quarter falling 1.6%. Prime Minister Jacinda Ardern’s government, which faces an election on Oct. 17, had warned of a huge drop in activity in the June quarter, but said success in suppressing the virus locally is likely to help recovery prospects.

“Industries like retail, accommodation, and restaurants, and transport saw significant declines in production because they were most directly affected by the international travel ban and strict nationwide lockdown,” national accounts senior manager Paul Pascoe said. “Other industries, like food and beverage manufacturing, were essential services and fell much less.”

On the other hand, the dollar edged up against major currencies on Thursday following the U.S. Federal Reserve’s upbeat assessment of the economic recovery, and as its increased tolerance for higher inflation push bond yields higher.

At its policy meeting, the Fed pledged to keep rates near zero until the labour market reaches “maximum employment” and inflation is on track to “moderately exceed” the 2% inflation target. The Fed also expects economic growth to improve from the corona virus-induced drop they projected in June.

The greenback initially fell after the Fed’s announcement, and weaker-than-expected U.S. retail sales data, but swung into positive territory after Chair Jerome Powell’s comment on economic outlook.

NZD/USD 4 Hour Chart:

Support: 0.6703 (S1), 0.6674 (S2), 0.6646 (S3).

Resistance: 0.6759 (R1), 0.6787 (R2), 0.6816 (R3).

The fall of the NZD’s GDP and the optimistic Fed Powell speech made Dollar stronger than kiwi. We expect a bearish trend for NZD/USD.