Fair Exchange rate of EUR/USD favors Euro

While EUR/USD has risen by over 5% so far this year, the exchange rate is still undervalued according to an analyst at Goldman Sachs. Analysts at Goldman Sachs believe EUR/USD is in a good position to benefit from a continued sell-off in the greenback.

The dollar index, which tracks the greenback’s value against majors, has declined by 10% over the past six months. According to the investment bank, the currency pair’s fair value is 1.30.

The ECB met last week and there was little that rhymed with ECB Chief Economist Lane outspoken concerns about the strength of the euro. Lane stated that inflation has been “significantly muted” by the stronger exchange rate, a step up from the remarks he made at the start of this month that “the EUR/USD rate does matter”.

On the other hand, many economists predict Federal Open Market Committee members won’t take any new actions when they wrap up a two-day gathering on Wednesday, an outcome likely to embolden bond bulls and further crimp inflation expectations. Fresh projections for the federal funds rate — bumped out a year to 2023 — are expected to show rates hammer locked at zero, something traders have mostly priced in already.

“The market definitely needs more from the Fed now,” Aneta Markowska, chief U.S. financial economist at Jefferies said. “The Fed will be undershooting on inflation for the better part of four years, so why wait to do more? And inflation expectations have already been fading.”

 The next focus will be on the Eurozone Industrial Production for July, scheduled for release at 09:00 GMT. The data is expected to show the factory output rebounded by 10% month-on-month in July, following June’s 9.1% rise.

EUR/USD 4 Hour Chart:

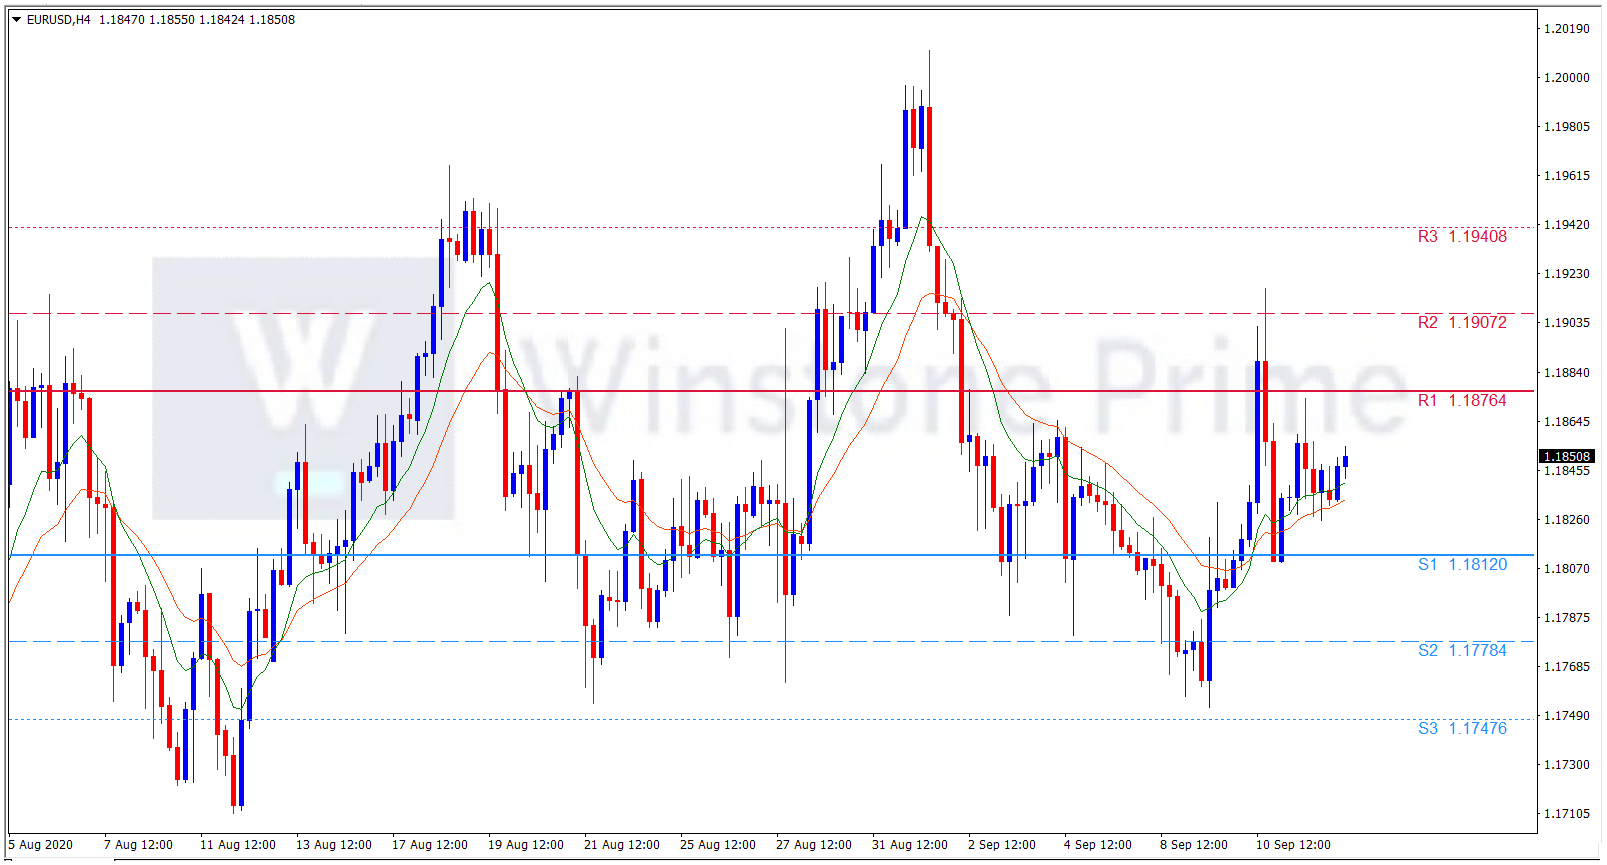
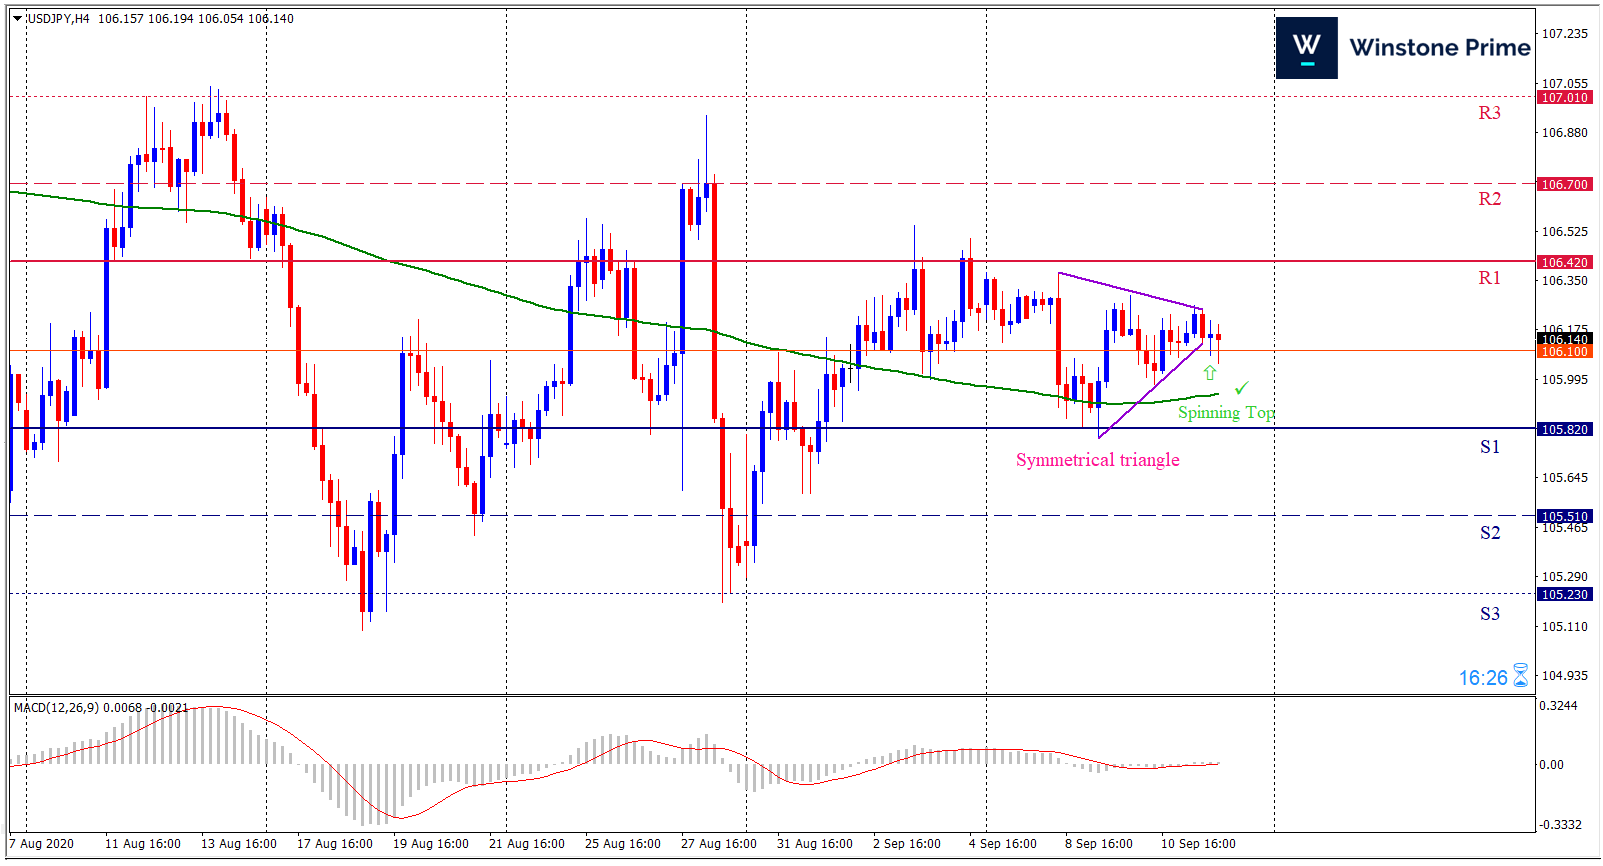
Support: 1.1812 (S1), 1.1779 (S2), 1.1748 (S3).

Resistance: 1.1876 (R1), 1.1907 (R2), 1.1941 (R3).

Amidst all the catalysts creating positive sentiments for Euro against the dollar, we expect a bullish trend for EUR/USD.

USD/JPY Weekly Forecast (14th September 2020 – 18th September 2020)

Fundamental view:

The pair showed a mixed trend last week as US and Japanese economic and central bank developments failed to provide direction or incentive for movement. Japanese statistics showed some improvement in the August measures but were far short of a robust recovery. NFIB Small Business Index on 8th Sept and US Core CPI monthly report on 10th Sept boosted uptrend for the pair whereas US Consumer Credit on 9th Sept and Japan Core Machinery Orders on 10th Sept favored downtrend for the pair.

American statistics were mixed in the last week and the greenback stayed under pressure which leads to the bearish candle.

The major economic events deciding the movement of the pair in the next week are US Core Retail Sales monthly report, FOMC Economic Projections at Sep 16, Japan Monetary Policy Statement, BOJ Press Conference, Unemployment Claims at Sep 17, and US CB Leading Index monthly report at Sep 18.

USD/JPY Weekly outlook:

Technical View:

Last week’s high was 0.15% than the previous week. Maintaining high at 106.38 and low at 105.79 showed a movement of 59 pips.

In the upcoming week we expect USD/JPY to show a bullish trend. The currency pair is trading above the 200 Simple Moving Average and the MACD trades to the upside. A solid breakout above 106.42 may open a clean path towards 106.70 and may take a way up to 107.01. Should 105.82 prove to be unreliable support, the USDJPY may sink downwards 105.51 and 105.23 respectively. In H4 chart, if breakout of the Symmetrical triangle is to the upside then bullish expectation is favored. Also to be noted spinning top formation exerts the expectation of uptrend for the pair.

Preference
Buy: 106.02 target at 106.69 and stop loss at 105.68


Alternate Scenario
Sell:  105.68 target at 105.16 and stop loss at 106.02

AUD/USD Weekly Forecast (14th September 2020 – 18th September 2020)

Fundamental view:

Aussie showed a mixed trend for the past week. US Consumer Credit monthly report on 9th Sept helped uptrend for the pair whereas US Core PPI monthly report on 10th Sept and US NFIB Small Business Index on 8th Sept helped downtrend for the pair.

The Australian Dollar will be closely watching the release of highly-scrutinized employment data on September 17. The event’s typical capacity for market-moving influence could mean a significant burst of volatility following the release. We expect a downtrend in the upcoming week. 

The major economic events deciding the movement of the pair in the next week are Australia Monetary Policy Meeting Minutes at Sep 15, Australia Unemployment Rate at Sep 17, US Core Retail Sales monthly report, FOMC Economic Projections at Sep 16, Unemployment Claims at Sep 17, and US CB Leading Index monthly report at Sep 18.

AUD/USD Weekly outlook:

Technical View:

Last week’s high was 1.20% lower than the previous week. Maintaining high at 0.7324 and low at 0.7192 showed a movement of 132 pips.

In the upcoming week we expect AUD/USD to show a bearish trend.  The currency pair is trading above the 200 Simple Moving Average and the MACD trades to the downside. A solid breakout below 0.7207 may open a clean path towards 0.7133 and may take a way down to 0.7075. Should 0.7340 prove to be unreliable resistance, the AUDUSD may raise upwards 0.7398 and 0.7472 respectively. In H4 chart Ascending Triangle breakout favors prospects of a bearish trend. Also to be noted bearish shooting star formation exerts the expectation of downtrend for the pair.

Preference
Sell: 0.7291 target at 0.7135 and stop loss at 0.7349


Alternate Scenario
Buy:  0.7349 target at 0.7472 and stop loss at 0.7291

XAU/USD Weekly Forecast (14th September 2020 – 18th September 2020)

Fundamental view:

Gold markets have pulled back a bit during the trading week, only to show signs of strength again just above the $1900 level. As the US dollar is trying to recover we expect the instrument to be bearish in the upcoming week.

Analysts note that rising inflation pressures continue to put pressure on real yields, which is a positive environment for gold; however, on the other side, some analysts have said that in the near-term, investors need to pay attention to strength in the U.S. dollar index.

The major economic events deciding the movement of the pair in the next week are Core Retail Sales monthly report, FOMC Economic Projections, Retail Sales monthly report at Sep 16, Unemployment Claims at Sep 17, Prelim UoM Consumer Sentiment, and CB Leading Index monthly report at Sep 18 for US.

XAU/USD Weekly outlook:

Technical View:

Last week’s high was 1.30% lower than the previous week. Maintaining high at 1966.5 and low at 1906.5 showed a movement of 600 pips.

In the upcoming week we expect XAU/USD to show a bearish trend.  The Instrument is trading below the 200 Simple Moving Average and the MACD trades to the downside. A solid breakout below 1909.4 may open a clean path towards 1877.9 and may take a way down to 1849.4. Should 1969.4 prove to be unreliable resistance, the XAUUSD may raise upwards 1997.9 and 2029.4 respectively. In H4 chart bearish butterfly pattern favors prospects of a bearish trend. Also to be noted bearish shooting star formation exerts the expectation of downtrend for the pair.

Preference
Sell:  1945.9 target at 1890.5 and stop loss at 1975.4


Alternate Scenario
Buy: 1975.4 target at 2025.9 and stop loss at 1945.9