BTC/USD Weekly Forecast (14th September 2020 – 18th September 2020)

Fundamental view:

Bitcoin fell in the beginning of the week later managed to tacked the strength of greenback. “The aggressive unwind of crowded positioning related to DeFi assets” could have contributed to the decline. However, other factors like whales taking profit, miners selling off their stashes, and a major South Korean exchange Bithumb reportedly being raided by police all might have applied selling pressure on Bitcoin.

Based on the increasing demand for Bitcoin as a potential hedge against inflation as well as the tone around BTC set by Wall Street giants like Paul Tudor Jones, Hirsch believes another major upsurge is a possibility: “Federal Reserve’s attempt to prop up the economy might fuel investors to look more closely at Bitcoin for a number of reasons, resulting in a positive uptick for the largest digital asset.”

The major economic events deciding the movement of the pair in the next week are Core Retail Sales monthly report, FOMC Economic Projections, Retail Sales monthly report at Sep 16, Unemployment Claims at Sep 17, Prelim UoM Consumer Sentiment, and CB Leading Index monthly report at Sep 18 for US.

BTC/USD Weekly outlook:

Technical View:

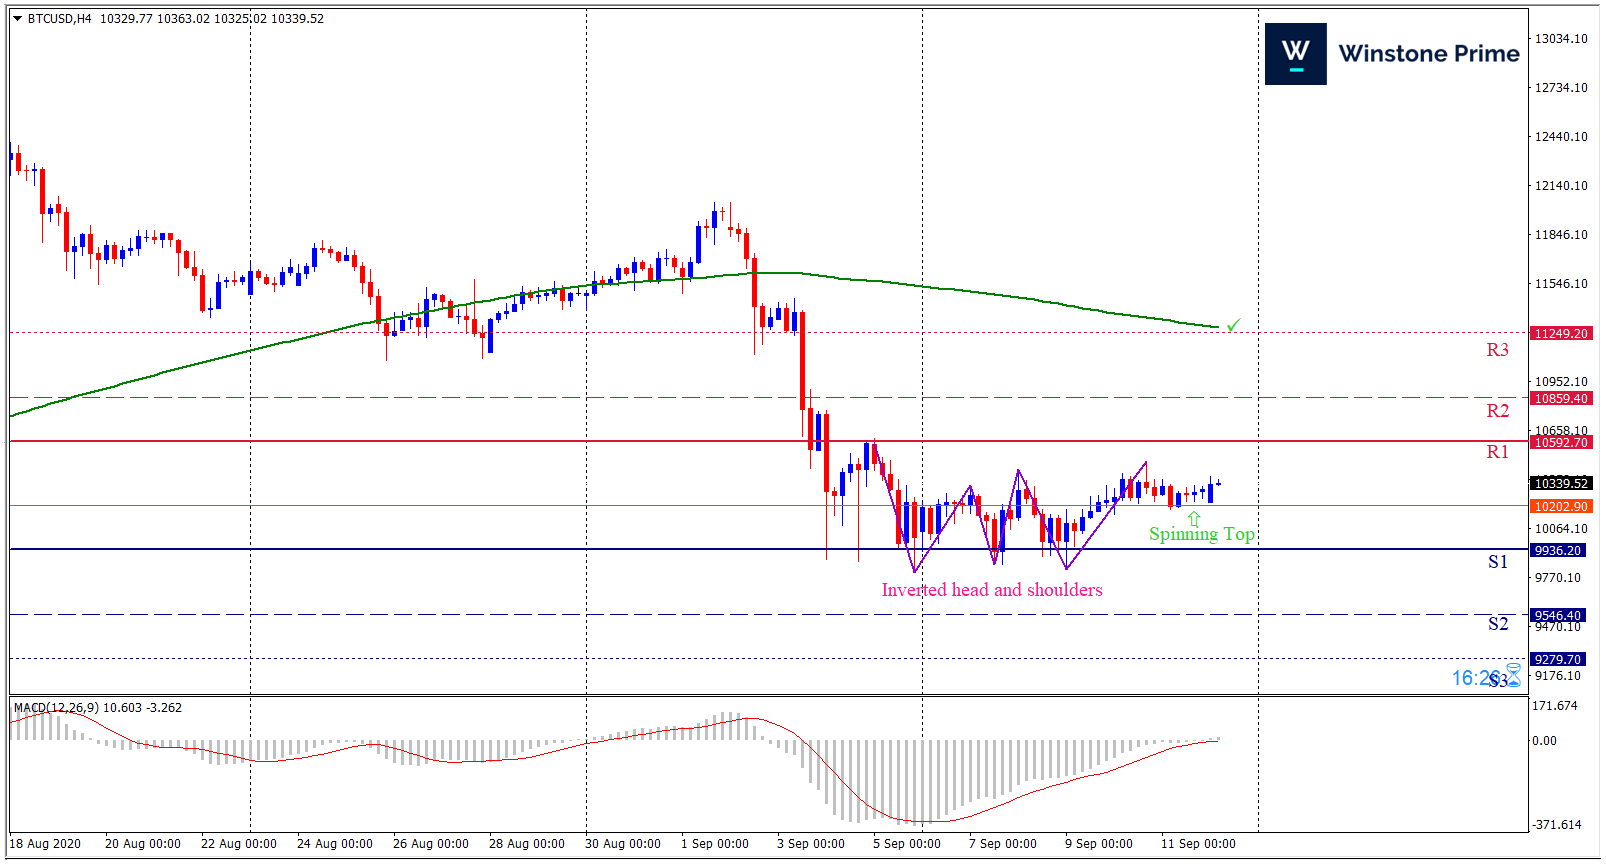
Last week’s high was 13.05% lower than the previous week. Maintaining high at 10469.5 and low at 9813.0 showed a movement of 656 pips.

In the upcoming week we expect BTC/USD to show a bullish trend. The Instrument is trading below the 200 Simple Moving Average and the MACD trades to the upside. A solid breakout above 10592.7 may open a clean path towards 10859.4 and may take a way up to 11249.2. Should 9936.2 prove to be unreliable support, the BTCUSD may sink downwards 9546.4 and 9279.7 respectively. In H4 chart formation of inverse head and shoulders creates prospects of a bullish trend. Spinning top pattern constructs a bullish outlook for the pair in the upcoming week.

Preference
Buy: 10311.5 target at 10858.9 and stop loss at 9931.7


Alternate Scenario
Sell: 9931.7 target at 9289.4 and stop loss at 10311.5

GBP/USD Weekly Forecast (14th September 2020 – 18th September 2020)

Fundamental view:

The British pound fell in the previous week .UK presented draft legislation that upends some of the Brexit Withdrawal Agreement, and the EU responded angrily. The news overwhelmed everything else and pounded the pound.  Britain Halifax HPI on 11th Sept favored uptrend for the pair whereas US JOLTS Job Openings on 9th Sept and US CPI monthly report on 11th Sept favored downtrend for the pair

The problem in the brexit deal and the rising cases of corona virus in UK is pressurizing pound and in the upcoming week we expect the GBP to fall.

The major economic events deciding the movement of the pair in the next week are UK Claimant Count Change at Sep 15, UK CPI yearly report at Sep 16, US Core Retail Sales monthly report, FOMC Economic Projections at Sep 16, UK MPC Official Bank Rate Votes, Unemployment Claims at Sep 17, and US CB Leading Index monthly report at Sep 18.

GBP/USD Weekly outlook:

Technical View:

Last week’s high was 1.65% lower than the previous week. Maintaining high at 1.3259 and low at 1.2762 showed a movement of 497 pips.

In the upcoming week we expect GBP/USD to show a bearish trend.  The currency pair is trading below the 200 Simple Moving Average and the MACD trades to the downside. A solid breakout below 1.2620 may open a clean path towards 1.2443 and may take a way down to 1.2123. Should 1.3116 prove to be unreliable resistance, the GBPUSD may raise upwards 1.3436 and 1.3613 respectively. Chart formation of Pennant pattern breakout in H4 chart favors prospects of a bearish trend. Bearish harami pattern formation escalates the expectation for a bearish trend.

Preference
Sell: 1.2822 target at 1.2444 and stop loss at 1.3119


Alternate Scenario
Buy:  1.3119 target at 1.3435 and stop loss at 1.2815

EUR/USD Weekly Forecast (14th September 2020 – 18th September 2020)

Fundamental view:

The American dollar appreciated throughout the first half of the week, in the heels of the momentum triggered by encouraging data released the previous Friday coupled with the absence of relevant macroeconomic news but in later part it turned in to opposite direction as the shared currency got vote of confidence from market players on Thursday, following the European Central Bank monetary policy meeting. Europe German Industrial Production on 7th Sept and Europe French Final Private Payrolls on 8th Sept created a bearish environment and US credit monthly report on 9th Sept and Europe Italian Industrial Production monthly report on 10th Sept created bullish environment for the pair.

The major economic events deciding the movement of the pair in the next week are ZEW Economic Sentiment at Sep 15, Europe Trade Balance, US Core Retail Sales monthly report, FOMC Economic Projections at Sep 16, Unemployment Claims at Sep 17, and US CB Leading Index monthly report at Sep 18.

EUR/USD Weekly outlook:

Technical View:

Last week’s high was 0.78% lower than the previous week. Maintaining high at 1.1917 and low at 1.1752 showed a movement of 165 pips.

In the upcoming week we expect EUR/USD to show a bearish trend. The currency pair is trading below the 100 Simple Moving Average and the MACD trades to the downside. A solid breakout below 1.1760 may open a clean path towards 1.1674 and may take a way down to 1.1595. Should 1.1924 prove to be unreliable resistance, the EURUSD may raise upwards 1.2003 and 1.2089 respectively. Chart formation of a Bearish crab in H4 chart sets prospects for a bearish trend. Bearish harami formation in H4 chart escalates the expectation for a bearish trend.

Preference
Sell: 1.1857 target at 1.1712 and stop loss at 1.1939


Alternate Scenario
Buy:  1.1939 target at 1.2088 and stop loss at 1.1855

Momentum Breakout Trading Strategy

We must be able to identify support and resistance levels as that’s where are going to use this strategy.

The two possible scenarios that we will see sometimes happening on charts are as follows.

  • By monitoring a support level, maybe hoping to buy on the upward bounce of price on that support level but it does not happen. What we see is a very long bearish candlestick that breaks the support level without any hesitation and closes below it.
  • Or, we are monitoring a resistance level and maybe hoping to sell when price hits that level and falls back but that does not happen. What we see is a very long bullish candlestick that breaks the resistance level and closes above it.


The candlestick that causes the breakout is called the momentum candlestick.

Timeframes :  15 minutes, 30 minutes, 1 hour and 4 hour.

Instrument :  Any but prefer majors because of their lower spreads.

Indicators : None

Buy setup and buy trading rules :

  • Initiate a buy order at market price as soon as we see a very bullish and long candlestick that closes above the resistance level.
  • Place stop loss at 2-5 pips below the low of that momentum candlestick.
  • Take profit should be set at 3 times what you risked.


See chart below for a buy setup example :

Sell setup and sell trading rules :

  • Initiate a sell order at market price as soon as we see a very bearish and long candlestick that closes below the support level.
  •  Place stop loss at 2-5 pips above the high of that momentum candlestick.
  • Take profit should be set at 3 times what you risked.


See chart below for a sell setup example :

Pros :

  • Spotting this kind of setup is easy.
  • No indicators are needed.


Cons :

  • As the momentum candlestick is a very long candlestick, stop loss distance are going to be huge. Thus use position sizing to reduce your risk.
  • Sometimes after a momentum candlestick breakout, price will not continue in that in the same manner as the momentum candlestick, it may go up and down, or sideways for a while before it continues again in the direction of the momentum candlestick.