BTC/USD Weekly Forecast (31st August 2020 – 4th September 2020)

Fundamental view:

Bitcoin fell in the last week and touched around 11k. The Fed’s plan to hold rates near zero for the foreseeable future is driving real Treasury yields below zero and forcing investors to find healthy returns elsewhere. Traders are experimenting with crypto currencies, anticipating their insulation from inflation will lift prices higher.

The major economic events deciding the movement of the pair in the next week are ISM Manufacturing PMI at Sep 01, ADP Non-Farm Employment Change, Crude Oil Inventories at Sep 02, ISM Non-Manufacturing PMI, at Sep 03, Average Hourly Earnings monthly report, Unemployment Rate at Sep 04 for US.

BTC/USD Weekly outlook:

Technical View:

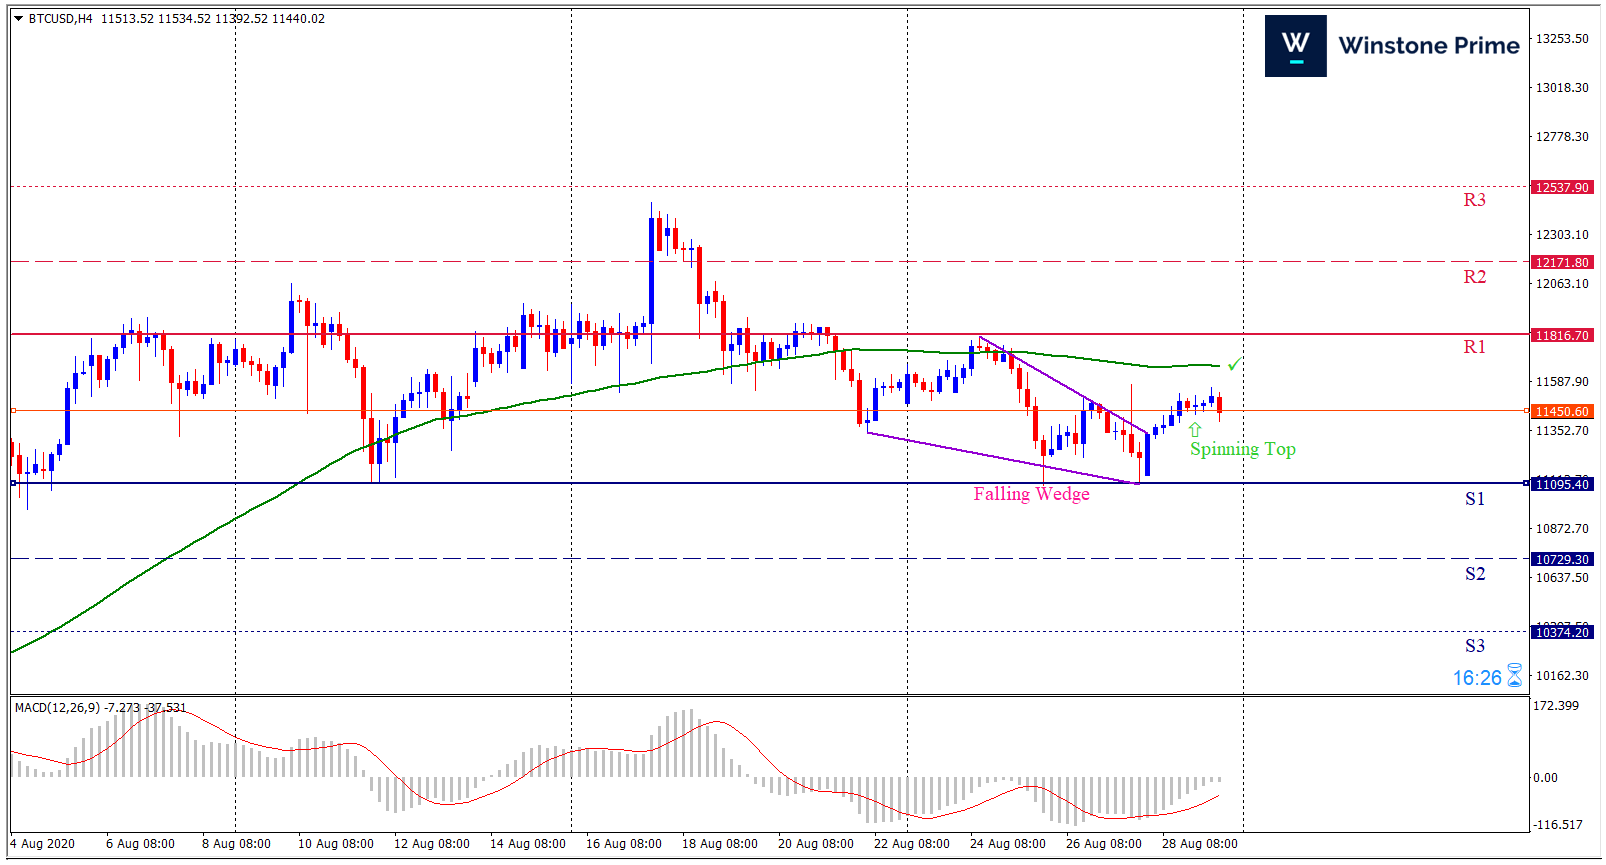
Last week’s high was 5.24% lower than the previous week. Maintaining high at 11805.8 and low at 11084.5 showed a movement of 721 pips.

In the upcoming week we expect BTC/USD to show a bearish trend. The Instrument is trading below the 100 Simple Moving Average and the MACD trades to the upside. A solid breakout above 11816.7 may open a clean path towards 12171.8  and may take a way up to12537.9. Should 11095.4 prove to be unreliable support, the BTCUSD may sink downwards 10729.3  and 10374.2 respectively. In H4 chart, breakout of the Falling wedge favors prospects of bullish trend and spinning top formation support our prospect.

Preference
Buy: 11374.5 target at 11970.9 and stop loss at 11108.7


Alternate Scenario
Sell: 11108.7 target at 10726.2 and stop loss at 11374.5

GBP/USD Weekly Forecast (31st August 2020 – 4th September 2020)

Fundamental view:

The British pound has shown itself to be resilient in the last week, breaking to a fresh, new high, before giving back some of the gains Britain CBI Realized Sales on 25th August and US Prelim GDP quarterly report on 27th Aug created a bearish trend for the pair whereas US CB Consumer Confidence on 25th Aug and US Natural Gas Storage report on 27th August favored a bullish trend.

Until Federal Reserve changes its tone, Pound will be stronger but Brexit talks might lurk the trend, which cannot be ignored.

The major economic events deciding the movement of the pair in the next week are US ISM Manufacturing PMI at Sep 01, UK MPC Member Broadbent Speaks, US ADP Non-Farm Employment Change at Sep 02, UK Final Services PMI, US ISM Non-Manufacturing PMI at Sep 03, and US Unemployment Rate at Sep 04.

GBP/USD Weekly outlook

Technical View:

Last week’s high was 0.67% higher than the previous week. Maintaining high at 1.3356 and low at 1.3053 showed a movement of 303 pips.

In the upcoming week we expect GBP/USD to show a bullish trend.  The currency pair is trading above the 200 Simple Moving Average and the MACD trades to the upside. A solid breakout above 1.3454 may open a clean path towards 1.3556 and may take a way up to 1.3757. Should 1.3151 prove to be unreliable support, the GBPUSD may sink downwards 1.2951 and 1.2848 respectively. Breakout of the W pattern favors prospects of a bullish trend. Bullish engulfing pattern formation escalates the expectation for a bullish trend.

Preference
Buy:  1.3251 target at 1.3502 and stop loss at 1.3145


Alternate Scenario
Sell: 1.3145 target at 1.2912 and stop loss at 1.3251

USD/JPY Weekly Forecast (31st August 2020 – 4th September 2020)

Fundamental view:

The US dollar has initially tried to rally against the Japanese yen, but gave back quite a bit of the gains, especially on Friday. Japan BOJ Core CPI on25th August and US Core Durable Goods Orders on 26th August supported upward movements for the pair whereas Japan SPPI yearly report on 26th August and US Unemployment Claims on 27th August favored downtrend for the pair.

The dollar is going to struggle to find its footing, mainly because the Federal Reserve has come out and said that it is going to raise the bar for raising interest rates.

The major economic events deciding the movement of the pair in the next week are Japan Unemployment Rate at Aug 31, Japan Final Manufacturing PMI, US ISM Manufacturing PMI at Sep 01, US ADP Non-Farm Employment Change at Sep 02, US ISM Non-Manufacturing PMI, at Sep 03, US Unemployment Rate at Sep 04.

USD/JPY Weekly outlook:

Technical View:

Last week’s high was 0.27% higher than the previous week. Maintaining high at 106.94 and low at 105.20 showed a movement of 175 pips.

In the upcoming week we expect USD/JPY to show a bearish trend. The currency pair is trading below the 200 Simple Moving Average and the MACD trades to the downside. A solid breakout below 104.71 may open a clean path towards 104.08 and may take a way down to 102.96. Should 106.46 prove to be unreliable resistance, the USDJPY may raise upwards 107.57 and 108.20 respectively. In H4 chart, Formation of Ascending broadening wedge pattern breakout indicates reversal of the trend creating prospects of a bearish trend Along with a three black crows formation braces our expectation.

Preference
Sell:  105.54 target at 104.12 and stop loss at 106.52


Alternate Scenario
Buy: 106.52 target at 108.15 and stop loss at 105.54

XAU/USD Weekly Forecast (31st August 2020 – 4th September 2020)

Fundamental view:

The yellow metal initially pulled back during the week, but benefited from broad-based US dollar weakness, as global markets cheer Fed’s lower rates for a longer period and down greenback’s haven demand.

Ultimately, the market should continue to go a lot of choppiness, but as the Federal Reserve has raised the bar again for interest rate hikes, Gold markets will continue to rally, right along with the other precious metals markets.             

The major economic events deciding the movement of the pair in the next week are ISM Manufacturing PMI at Sep 01, ADP Non-Farm Employment Change, Crude Oil Inventories at Sep 02, ISM Non-Manufacturing PMI, at Sep 03, Average Hourly Earnings monthly report, Unemployment Rate at Sep 04 for US.

XAU/USD Weekly outlook:

Technical View:

Last week’s high was 1.93% lower than the previous week. Maintaining high at 1976.7 and low at 1902.7 showed a movement of 740 pips.

In the upcoming week we expect XAU/USD to show a bullish trend.  The Instrument is trading above the 200 Simple Moving Average and the MACD trades to the upside. A solid breakout above 1994.9 may open a clean path towards 2022.7 and may take a way up to 2068.8. Should 1920.9 prove to be unreliable support, the XAUUSD may sink downwards 1874.9 and 1847.0 respectively. In H4 chart breakout of the symmetrical triangle favors prospects of a bullish trend. Also to be noted bullish engulfing formation exerts the expectation of downtrend for the pair.

Preference
Buy:  1957.2 target at 2015.7 and stop loss at 1932.8


Alternate Scenario
Sell: 1932.8 target at 1875.1  and stop loss at 1957.2