USD/JPY Weekly Forecast (24th August 2020 – 28th August 2020)

Fundamental view:

Japan Prelim GDP Price Index yearly report and Prelim GDP quarterly report on 17th Aug and Japan Core Machinery Orders at 19th Aug created a bullish market for the pair whereas US Empire State Manufacturing Index on 17th Aug and US Unemployment Claims  on 20th created a bearish environment for the pair.

Yen became stronger than Dollar due the positive Japanese core consumer index of the previous week. But we expect that yen will struggle against the recovering dollar.

The major economic events deciding the movement of the pair in the next week are BOJ Core CPI yearly report, US CB Consumer Confidence at Aug 25, US Core Durable Goods Orders monthly report at Aug 26, Japan All Industries Activity monthly report, US Prelim GDP quarterly report, Fed Chair Powell Speaks at Aug 27, Jackson Hole Symposium at Aug 27 & 28.

USD/JPY Weekly outlook:
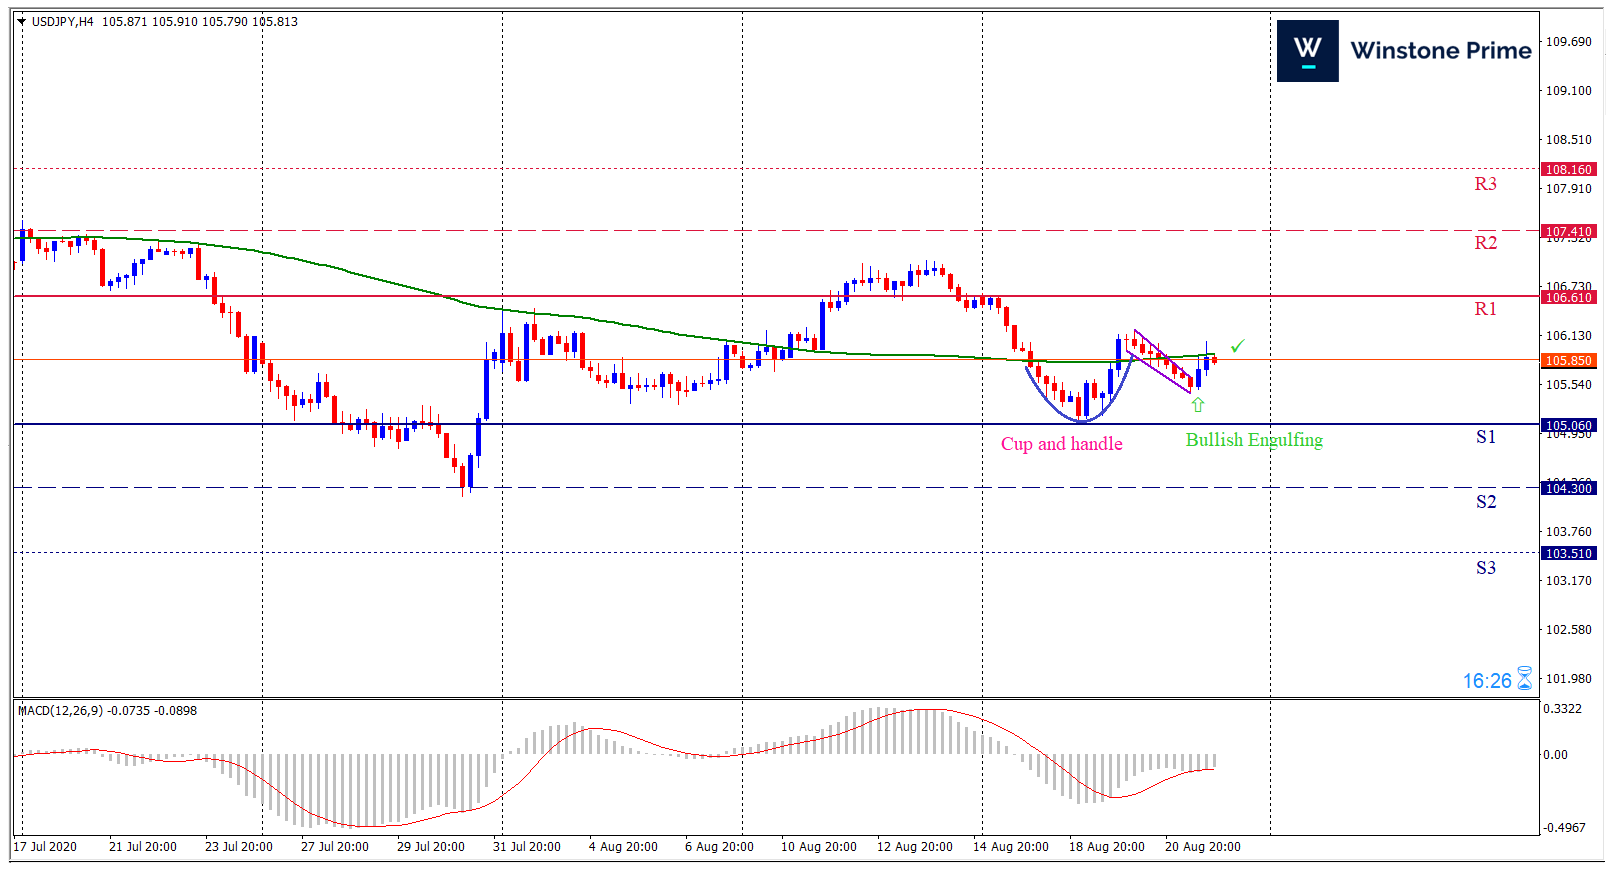
Technical View:

Last week’s high was 0.37% lower than the previous week. Maintaining high at 106.65 and low at 105.10 showed a movement of 155 pips.

In the upcoming week we expect USD/JPY to show a bullish trend. The currency pair is trading below the 100 Simple Moving Average and the MACD trades to the downside. A solid breakout above 106.61 may open a clean path towards 107.41 and may take a way up to 108.16. Should 105.06 prove to be unreliable support, the USDJPY may sink downwards 104.30 and 106.51 respectively. In H4 chart, Formation of Cup and handle pattern creating prospects of a bullish trend Along with a bullish engulfing formation braces our expectation.

Preference
Buy: 105.75 target at 107.16 and stop loss at 105.01


Alternate Scenario
Sell:  105.01 target at 103.55 and stop loss at 105.75

GBP/USD Weekly Forecast (24th August 2020 – 28th August 2020)

Fundamental view:

The British pound was up in the week initially and later fell down. Britain CPI yearly report and Core CPI yearly report on 19th Aug, US Unemployment Claims on 20th Aug, favored uptrend whereas US NAHB Housing Market Index on 17th Aug and Britain GfK Consumer Confidence on 21st Aug favored downtrend.

Dollar gained strength due to FOMC meeting release last week which made Dollar strong against Pound. In the upcoming week also we expect the Dollar to be strong against pound.

The major economic events deciding the movement of the pair in the next week are Confederation of British Industry (CBI) Realized Sales US CB Consumer Confidence at Aug 25, US Core Durable Goods Orders monthly report at Aug 26, US Prelim GDP quarterly report, Fed Chair Powell Speaks at Aug 27, BOE Gov Bailey Speaks, Jackson Hole Symposium at Aug 27 & 28.

GBP/USD Weekly outlook:

Technical View:

Last week’s high was 0.95% higher than the previous week. Maintaining high at 1.3267 and low at 1.3058 showed a movement of 208 pips.

In the upcoming week we expect GBP/USD to show a bearish trend.  The currency pair is trading above the 200 Simple Moving Average and the MACD trades to the downside. A solid breakout below 1.3009 may open a clean path towards 1.2930 and may take a way down to 1.2801. Should 1.3218 prove to be unreliable resistance, the GBPUSD may raise upwards 1.3347 and 1.3426 respectively. Chart formation of Double top pattern in H4 chart favors prospects of a bearish trend. Bearish engulfing pattern formation escalates the expectation for a bearish trend.

Preference
Sell: 1.3098 target at 1.2914 and stop loss at 1.3229


Alternate Scenario
Buy:  1.3229 target at 1.3423 and stop loss at 1.3098

AUD/USD Weekly Forecast (24th August 2020 – 28th August 2020)

Fundamental view:

Aussie showed a mixed trend for the past week. US Empire State Manufacturing Index on 17th Aug and US Crude Oil Inventories on 19th Aug framed bullish trend for the pair whereas US Building Permits, Housing Starts on 18th Aug and Australia Flash Manufacturing PMI on 21st Aug set a bearish environment for the pair.

The Dollar becomes stronger than Aussie in the previous week which made the pair to struggle last week.

The major economic events deciding the movement of the pair in the next week are US CB Consumer Confidence at Aug 25, Australia Construction Work Done quarterly report US Core Durable Goods Orders monthly report at Aug 26, Australia Private Capital Expenditure quarterly report, US Prelim GDP quarterly report, Fed Chair Powell Speaks at Aug 27, Jackson Hole Symposium at Aug 27 & 28.

AUD/USD Weekly outlook:

Technical View:

Last week’s high was 1.19% higher than the previous week. Maintaining high at 0.7275 and low at 0.7135 showed a movement of 140 pips.

In the upcoming week we expect AUD/USD to show a bearish trend.  The currency pair is trading above the 200 Simple Moving Average and the MACD trades to the downside. A solid breakout below 0.7105 may open a clean path towards 0.7050 and may take a way down to 0.6965. Should 0.7245 prove to be unreliable resistance, the AUDUSD may raise upwards 0.7330 and 0.7382 respectively. In H4 chart Head and shoulder pattern favors prospects of a bearish trend. Also to be noted Three inside down formation exerts the expectation of downtrend for the pair.

Preference
Sell: 0.7175 target at 0.7021 and stop loss at 0.7249


Alternate Scenario
Buy:  0.7249 target at 0.7381 and stop loss at 0.7175

BTC/USD Weekly Forecast (24th August 2020 – 28th August 2020)

Fundamental view:

The latest update that ‘Crypto-exchanges have to comply with SEC rules’ makes crypto weaker against the recovering dollar in the past week.

The optimism among the investors for the dollar makes Bitcoin to fall and we expect it to continue in the upcoming week.

The major economic events deciding the movement of the pair in the next week are The major economic events deciding the movement of the pair in the next week are CB Consumer Confidence at Aug 25, US Core Durable Goods Orders monthly report, Crude Oil Inventories at Aug 26, US Prelim GDP quarterly report, Fed Chair Powell Speaks at Aug 27 for US, Jackson Hole Symposium at Aug 27 & 28.

BTC/USD Weekly outlook:

Technical View:

Last week’s high was 3.27% higher than the previous week. Maintaining high at 12459.2 and low at 11371.5 showed a movement of 1087 pips.

In the upcoming week we expect BTC/USD to show a bearish trend. The Instrument is trading below the 100 Simple Moving Average and the MACD trades to the downside. A solid breakout below 11314.4 may open a clean path towards 10800.1 and may take a way down to 10228.8. Should 12400.1 prove to be unreliable resistance, the BTCUSD may raise upwards 12971.4 and 13485.7 respectively. In H4 chart Symmetrical breakout favors prospects of a bearish trend. Three Black Crows pattern constructs a bearish outlook for the pair in the upcoming week.

Preference
Sell: 11435.2 target at 10719.4 and stop loss at 11890.5


Alternate Scenario
Buy: 11890.5 target at 12379.2 and stop loss at 11435.2