Japan’s consumer price index braces Yen

Japan’s core consumer prices were unchanged in July from a year earlier, government data showed on Friday. The core consumer price index, which includes oil products but excludes fresh food prices, compared with economists’ median estimate for a 0.1 percent annual gain. Stripping away the effect of fresh food and energy, consumer prices rose 0.4 percent in July from a year ago. whereas the preliminary readings of the Jibun Manufacturing PMI gained beyond 45.2 previous readouts to 46.6.

“Core CPI is likely to stay largely flat towards next year,” said Yasunari Ueno, chief market economist at Mizuho Securities.

The latest chatters that Japan’s ease of corona virus (COVID-19)-led restrictions for foreign residents also helped the Japanese Yen. Japan plans to ease its COVID-19 entry restrictions on foreign nationals with resident visas starting next month, after an outcry over the emotional and economic hardship that the measures are inflicting. Re-entry will be permitted for visa holders, including permanent residents and exchange students, on condition that they undergo corona virus testing and quarantine for 14 days, the same policy that applies to Japanese citizens re-entering the country, reported on Friday.

The move ignores the Tokyo surge in virus cases for Thursday. As per the Kyodo News, “Tokyo reported on Thursday 339 additional cases of novel corona virus infection, topping the 300 mark for the first time since Saturday, the metropolitan government said.”

On the Other hand, On Thursday, the data published by the US Department of Labor showed that Initial Jobless Claims rose above 1 million after declining to 971,000 last week. Additionally, the Philly Fed Manufacturing Index dropped from 24.1 in July to 17.2 in August.

Elsewhere, the US House Speaker Nancy Pelosi said, “Timing is not right for a smaller corona virus relief bill.” The Democrat earlier showed readiness to cut the aid package amount demand in half to renew hopes of America’s much-awaited stimulus. Furthermore, American Secretary of State Mike Pompeo’s tough stand against Iran and no clarity over the US-China trade talk also play a role in the latest risk moves.

USD/JPY 4 Hour Chart:

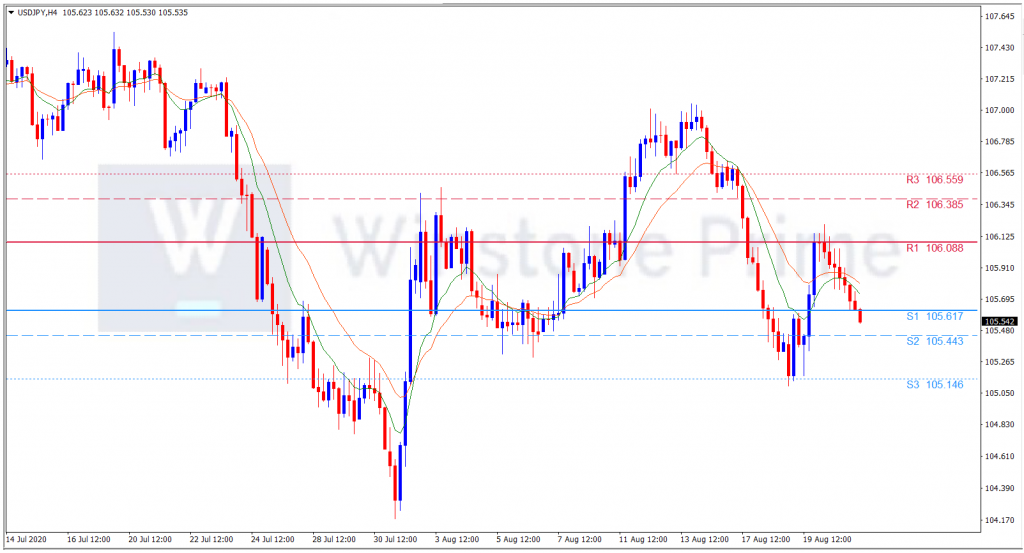
Support: 105.62 (S1), 105.44 (S2), 105.15 (S3).

Resistance: 106.09 (R1), 106.39 (R2), 106.56 (R3).

The positive Japanese core consumer index and US initial jobless data drives Yen stronger than Dollar. We expect a bearish trend for USD/JPY.

FOMC meeting minutes strengthens Greenback

European stocks slipped on Wednesday, failing to draw strength from a record run for Wall Street’s S&P 500, as investors feared a resurgence in corona-virus cases could affect the economic recovery in the continent.

Eurozone governments will consider shutting down parts of the economy again to control what is increasingly looking like a second wave of the virus, and how this will influence policy at the European Central Bank. But even if a full-blown second outbreak can be avoided, there’s a high risk the recovery stalls over the coming months amid the realization that there’s a limit to how far business life can return to normal during a global pandemic. A stronger exchange rate could also create headaches for the euro bloc as it would make exports more expensive, further straining the recovery.

“The EU released its June Current Account on Wednesday, which came in at €20.69 B better than the previous €7.95 B. The Union also published July inflation, with the monthly CPI down to -0.4% from 0.3% in the previous month. The annual figure, however, came in as expected at 0.4%, while the core annual CPI hit 1.2%, as expected.”

On the Other hand, the FOMC July meeting’s minutes supported the dollar. The document was quite similar to the one of the previous meeting, although it added an encouraging line, as policymakers said that economic activity and employment have picked up somewhat in recent months, nothing that anyway remain well below their pre-pandemic levels. The document gave the greenback another lift against its major rivals.

Apple and other well-established tech giants such as Microsoft, Google, Amazon, Facebook, and Netflix have thrived during the upheaval as the pandemic has forced millions of people to work, attend classes, shop, and entertain themselves at home. Apple’s stock has climbed nearly 60 percent this year. In recent weeks, the rally has been bolstered by excitement over a four-for-one stock split that Apple announced late last month in an effort to make its shares more affordable to a wider swath of investors.

EUR/USD 4 Hour Chart:

Support: 1.1793 (S1), 1.1750 (S2), 1.1671 (S3).

Resistance: 1.1915 (R1), 1.1995 (R2), 1.2037 (R3).

These catalysts drive Dollar stronger than Euro. The focus of the investors now shifts towards the US Jobless Claims, Philly Fed Manufacturing Survey, and the European Central Bank (ECB) policy meeting’s minutes due later today for fresh trading directives. We expect a bearish trend for EUR/USD.

UK CPI braces Pound

The UK Consumer Prices Index (CPI) 12-month rate came in at +1.0% in July when compared to +0.6% booked in June while beating expectations of a +0.6% print, the UK Office for National Statistics (ONS) reported on Wednesday. Meanwhile, the core inflation gauge (excluding volatile food and energy items) arrived at +1.8% YoY last month versus +1.4% booked in June while beating the consensus forecast of +1.3%.

As per the ONS, “The largest contribution to the CPIH 12-month inflation rate in July 2020 came from recreation and culture (0.33 percentage points).

Clothing, rising prices at the petrol pump, and furniture and household goods made large upward contributions to the change in the CPIH 12-month inflation rate between June and July 2020. Falling food prices resulted in a partially offsetting small downward contribution to the change.”

U.K. and European Union officials have the next seven weeks to find something that has eluded them since March an agreement over their future relationship. Britain and the bloc want to reach an agreement before the negotiations are scheduled to conclude Oct. 2 — but, so far, neither has made adequate concessions for the other. Each is waiting for the other to blink first, according to officials in both camps. Given that, there is little prospect of a breakthrough this week, said one EU official, who spoke on condition of anonymity because the talks are held in private.

On the Other hand, Experts are again sounding the alarm that the dollar could lose its role as the world’s reserve currency. This is a frequent and historically unconsummated concern — but things may actually be different this time. As new data from the Bank of Russia show the country now receives more euros than dollars for its exports to China, with the share of goods purchased in euro’s rising from 0.3% at the start of 2014 (and just 1.3% in the second quarter of 2018) to nearly 51% at the end of Q1 this year. The share of euro’s Russia receives for exports to the European Union increased to 43% from 38% at the end of last year, the data show.

GBP/USD 4 Hour Chart:

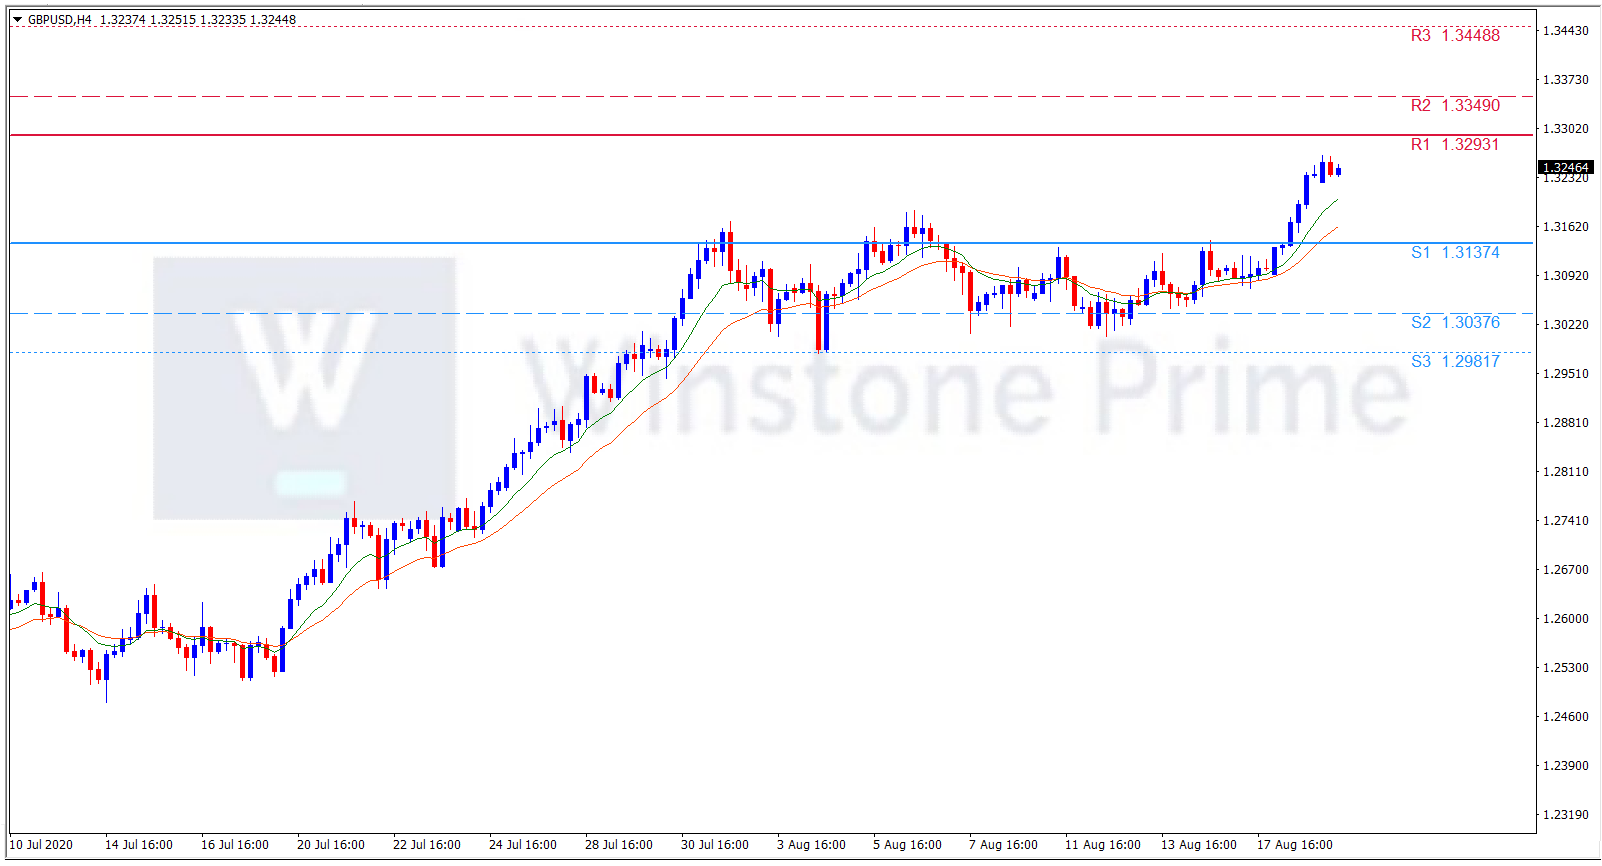
Support: 1.3137 (S1), 1.3038 (S2), 1.2982 (S3).

Resistance: 1.3293 (R1), 1.3349 (R2), 1.3449 (R3).

All the catalysts strengthens Sterling against the weakening greenback. We expect a bullish trend for GBP/USD.


Why use price action analysis in Trading?

Price Action Analysis :

Price action describes the characteristics of a security’s price movements. This movement is quite often analyzed with respect to price changes in the recent past. Price action analysis is the act of studying, reading and interpreting the price movement of a market over time, which involves the use of raw price charts to trade the market (no indicators). By learning to read the price action of a market, we can determine a market’s directional bias as well as trade from reoccurring price action patterns or price action setups that reflect changes or continuations in market sentiment.

Since it ignores the fundamental analysis factors and focuses more on recent and past price movement, the price action trading strategy is dependent on technical analysis tools.

In simpler terms it can be defined as price action analysis is the use of the natural or “raw” price movement of a market to analyze and trade it. This means, you are making all of your trading decisions based purely on the price bars on a “naked” or indicator-free price chart.

How it works

All economic variables create price movement which can be easily seen on a market’s price chart. Whether an economic variable is filtered down through a human trader or a computer trader, the movement that it creates in the market will be easily visible on a price chart. Therefore, instead of trying to analyze a million economic variables each day, Make Use of price action analysis because this style of trading allows you to easily analyze and make use of all market variables by simply reading and trading off of the price action created by said market variables.

Price action analysis can be used to trade any financial market, since it simply makes use of the “core” price data of the market. However, the Forex market, mainly due to its deep liquidity which makes it easy to enter and exit the market, and also because the Forex market tends to have better trending conditions as well as more volatility which makes for better directional trading and allows price action trading to really shine.

Applying price action analysis in trading

You can trade effectively from a few time-tested price action setups. There really is no need to try and trade from 25 different price patterns, the Forex market moves in a relatively predictable fashion most of the time, so all we need is a handful of effective price action entry setups to give us a good chance at finding and entering high-probability trades.

The first thing you need to do to apply price action to the trading, is to strip your charts of all indicators and get a “clean” price chart with only the price bars in a color you like. We choose a simple blue and red price chart. Here’s an example of a daily chart setup on the EURUSD:

price action1

From looking at the above chart, you will get a clean and simple price movement with natural price action of a Forex market. We have a solid method to trade based only on price movement (price action analysis), it only makes sense that we would use that instead of trying to analyze messy secondary data like indicators (All indicators are derived from price movement).

Price action trading signal

Next, let’s discuss how we can use price action analysis to find entries into the Forex market from a raw price chart. In this price action method consists of a handful of very specific price action entry triggers that can provide you with a high-probability entry into the market. Essentially, what we are looking for is reoccurring price patterns that tell us something about what the market might do in the near-future.

In the chart below, we are going to look at a particularly good price action signal for trading with trends; the inside bar strategy.

In the example chart below, we can see one price action trading signal that we are commonly using in trending markets; the inside bar setup:

Price action2

Using price action analysis in identifying the markets trend

You may come across many different indicators designed to tell you what the trend of a market is. However, the most time-tested and trusted way for determining a market’s trend is simply to look at the daily charts and analyze the market’s price action. To identify a downtrend, we look for patterns of lower highs and lower lows, sometimes annotated by “LH and LL”. To identify an uptrend, we look for patterns of higher highs and higher lows, sometimes annotated by “HH and HL”.

In the example chart below, we can see examples of a downtrend, an uptrend and an uptrend changing to a downtrend:

Price action3

How to trade with confluence in price action signal?

When we say  “trading with confluence”  means when things come together or intersect. Thus, when we are looking to “trade with confluence” we are trying to put together an obvious price action signal with a significant level in the market. There are different factors of confluence that we can watch for, but in the chart below we have used price action setups that formed at key support and resistance levels in the market; support and resistance are each a factor of confluence.

Price action4

Conclusion

In this article you will get a basic overview of what price action analysis is and how to use it in the markets. A lot of theories and strategies are available on price action trading claiming high success rates, but traders should be aware of survivorship bias, as only success stories make news. Trading does have the potential for making handsome profits. It is up to the individual trader to clearly understand, test, select, decide and act on what meets his requirements for the best possible profit opportunities.