BTC/USD Weekly Forecast (17th August 2020 – 21st August 2020)

Fundamental view:

Bitcoin fell in the last week initially due to the positive sentiment for the greenback but it made a bounce back at the end of the week.

The recent update that China’s ministry of commerce has announced the initial launch of the country’s digital currency in selected cities. The cities that have been selected to pilot the digital currency include those in the northern Chinese region of Beijing-Tianjin-Hebei, eastern region of Yangtze River Delta, “Greater Bay Area” around the Pearl River Delta and some cities in Midwestern China seems to create optimism among investors towards Bitcoin.

The major economic events deciding the movement of the pair in the next week are Crude Oil Inventories, FOMC Meeting Minutes, OPEC-JMMC Meetings at Aug 19, and Unemployment Claims at Aug 20 and Flash Manufacturing PMI at Aug 21 for US.

BTC/USD Weekly outlook:

Technical View:

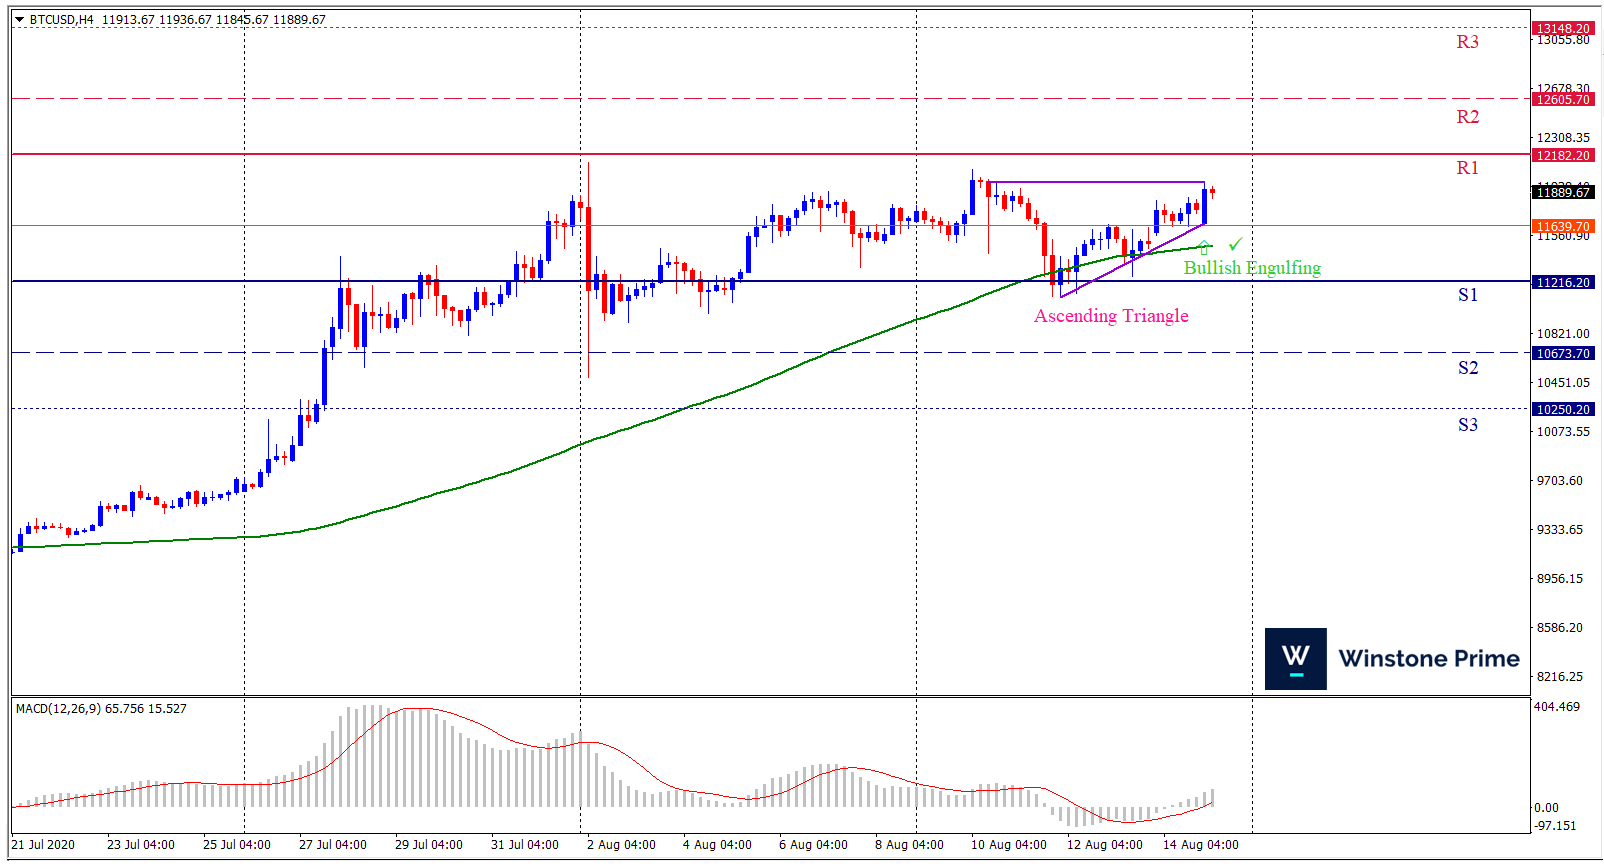
Last week’s high was 1.37% higher than the previous week. Maintaining high at 12063.2 and low at 11097.2 showed a movement of 966 pips.

In the upcoming week we expect BTC/USD to show a bullish trend. The Instrument is trading above the 100 Simple Moving Average and the MACD trades to the upside. A solid breakout above 12182.2 may open a clean path towards 12605.7 and may take a way up to 13148.2. Should 11216.2 prove to be unreliable support, the BTCUSD may sink downwards 10673.7 and 10250.2 respectively. In H4 chart Ascending Triangle breakout favors prospects of a bullish trend. Bullish engulfing pattern constructs a bullish outlook for the pair in the upcoming week.

Preference
Buy: 11787.2 target at 12600.5 and stop loss at 11211.9


Alternate Scenario
Sell: 11211.9 target at 10255.2 and stop loss at 11787.2

GBP/USD Weekly Forecast (17th August 2020 – 21st August 2020)

Fundamental view:

The British pound pulled back a bit in the week initially and bounced back to form a bullish rally. US JOLTS Job Openings on 11th Aug and US Core PPI monthly report on 11th Aug created a bearish trend for the pair whereas Unemployment Rate on 11th Aug and Prelim GDP quarterly report on 12th August favored a bullish trend.

The major economic events deciding the movement of the pair in the next week are Retail Price Index (RPI) yearly report, US Crude Oil Inventories, FOMC Meeting Minutes, OPEC-JMMC Meetings at Aug 19, and Unemployment Claims at Aug 20, UK Flash Manufacturing PMI at Aug 21.

GBP/USD Weekly outlook:

Technical View:

Last week’s high was 0.33% lower than the previous week. Maintaining high at 1.3142 and low at 1.3005 showed a movement of 138 pips.

In the upcoming week we expect GBP/USD to show a bearish trend.  The currency pair is trading above the 50 Simple Moving Average and the MACD trades to the downside. A solid breakout below 1.3016 may open a clean path towards 1.2941 and may take a way down to 1.2878. Should 1.3153 prove to be unreliable resistance, the GBPUSD may raise upwards 1.3217 and 1.3291 respectively. Chart formation of bearish bat pattern in H4 chart favors prospects of a bearish trend. Dark Cloud pattern formation escalates the expectation for a bearish trend.

Preference
Sell: 1.3072 target at 1.2946 and stop loss at 1.3158


Alternate Scenario
Buy:  1.3158 target at 1.3289 and stop loss at 1.3072

USD/JPY Weekly Forecast (17th August 2020 – 21st August 2020)

Fundamental view:

Positive economic data out of the United States appears to have been the primary driver behind the USD/JPY exchange rate’s recent recovery from the July low, as investors mull the lack of progress in fiscal stimulus talks between Republicans and Democrats. Current Account on 11th August, Japan PPI yearly report on 13th August created a bearish atmosphere for the pair whereas US JOLTS Job Openings on 10th Aug, CPI monthly report on 12th August created a bullish atmosphere.

The better than expected report of US in the past week created a bullish environment for the pair.

The major economic events deciding the movement of the pair in the next week are Japan Revised Industrial Production monthly report at Aug 17, US Crude Oil Inventories, FOMC Meeting Minutes, OPEC-JMMC Meetings at Aug 19, Japan National Core CPI yearly report and Unemployment Claims at Aug 20.

USD/JPY Weekly outlook:

Technical View:

Last week’s high was 0.54% higher than the previous week. Maintaining high at 107.05 and low at 105.70 showed a movement of 134 pips.

In the upcoming week we expect USD/JPY to show a bullish trend. The currency pair is trading above the 200 Simple Moving Average and the MACD trades to the upside. A solid breakout above 107.17 may open a clean path towards 107.78 and may take a way up to 108.51. Should 105.83 prove to be unreliable support, the USDJPY may sink downwards 105.10 and 104.49 respectively. In H4 chart, Formation of bullish butterfly pattern indicates reversal of the trend creating prospects of a bullish trend Along with a bullish spinning top formation braces our expectation.

Preference
Buy: 106.35 target at 107.27 and stop loss at 105.55


Alternate Scenario
Sell:  105.55 target at 104.49 and stop loss at 106.35

EUR/USD Weekly Forecast (17th August 2020 – 21st August 2020)

Fundamental view:

The Euro initially fell in the week initially but managed to overcome and formed a slightly bullish candle first and a bullish rally continued till the week. US Unemployment Claims bearish moment on 13th August created a bearish atmosphere for the pair whereas US JOLTS Job Openings on 10th August, Europe ZEW Economic Sentiment, German ZEW Economic Sentiment on 11th August favored bullish atmosphere for the pair.

The Market has surged higher in the past week and we expect it would be bit conscious in the upcoming week as the bullish rally is overextended now.

The major economic events deciding the movement of the pair in the next week are Euro group Meetings at Aug 17, US Crude Oil Inventories, FOMC Meeting Minutes, OPEC-JMMC Meetings at Aug 19, and Unemployment Claims at Aug 20. Europe Flash Manufacturing PMI at Aug 21.

EUR/USD Weekly outlook:

Technical View:

Last week’s high was 0.43% lower than the previous week. Maintaining high at 1.1864 and low at 1.1711 showed a movement of 153 pips.

In the upcoming week we expect EUR/USD to show a bearish trend. The currency pair is trading above the 100 Simple Moving Average and the MACD trades to the downside. A solid breakout below 1.1746 may open a clean path towards 1.1652 and may take a way down to 1.1593. Should 1.1899 prove to be unreliable resistance, the EURUSD may raise upwards 1.1958 and 1.2053 respectively. Chart formation of a Bearish butterfly pattern in H4 chart sets prospects for a bearish trend. Spinning top formation in H4 chart escalates the expectation for a bearish trend.

Preference
Sell: 1.1860 target at 1.1728 and stop loss at 1.1944


Alternate Scenario
Buy:  1.1944 target at 1.2083 and stop loss at 1.1860