XAU/USD Weekly Forecast (17th August 2020 – 21st August 2020)

Fundamental view:

Gold fell in the last week as optimism among investors developed for the greenback. Positive economic data out of the United States put pressure on the instrument last week.

The two biggest unknowns for next week is the U.S. fiscal package, which is still nowhere close to being passed, and the U.S.-China trade talks, which are restarting and could, trigger some major volatility.

The major economic events deciding the movement of the pair in the next week are Crude Oil Inventories, FOMC Meeting Minutes, OPEC-JMMC Meetings at Aug 19, and Unemployment Claims at Aug 20 and Flash Manufacturing PMI at Aug 21 for US.

XAU/USD Weekly outlook:

Technical View:

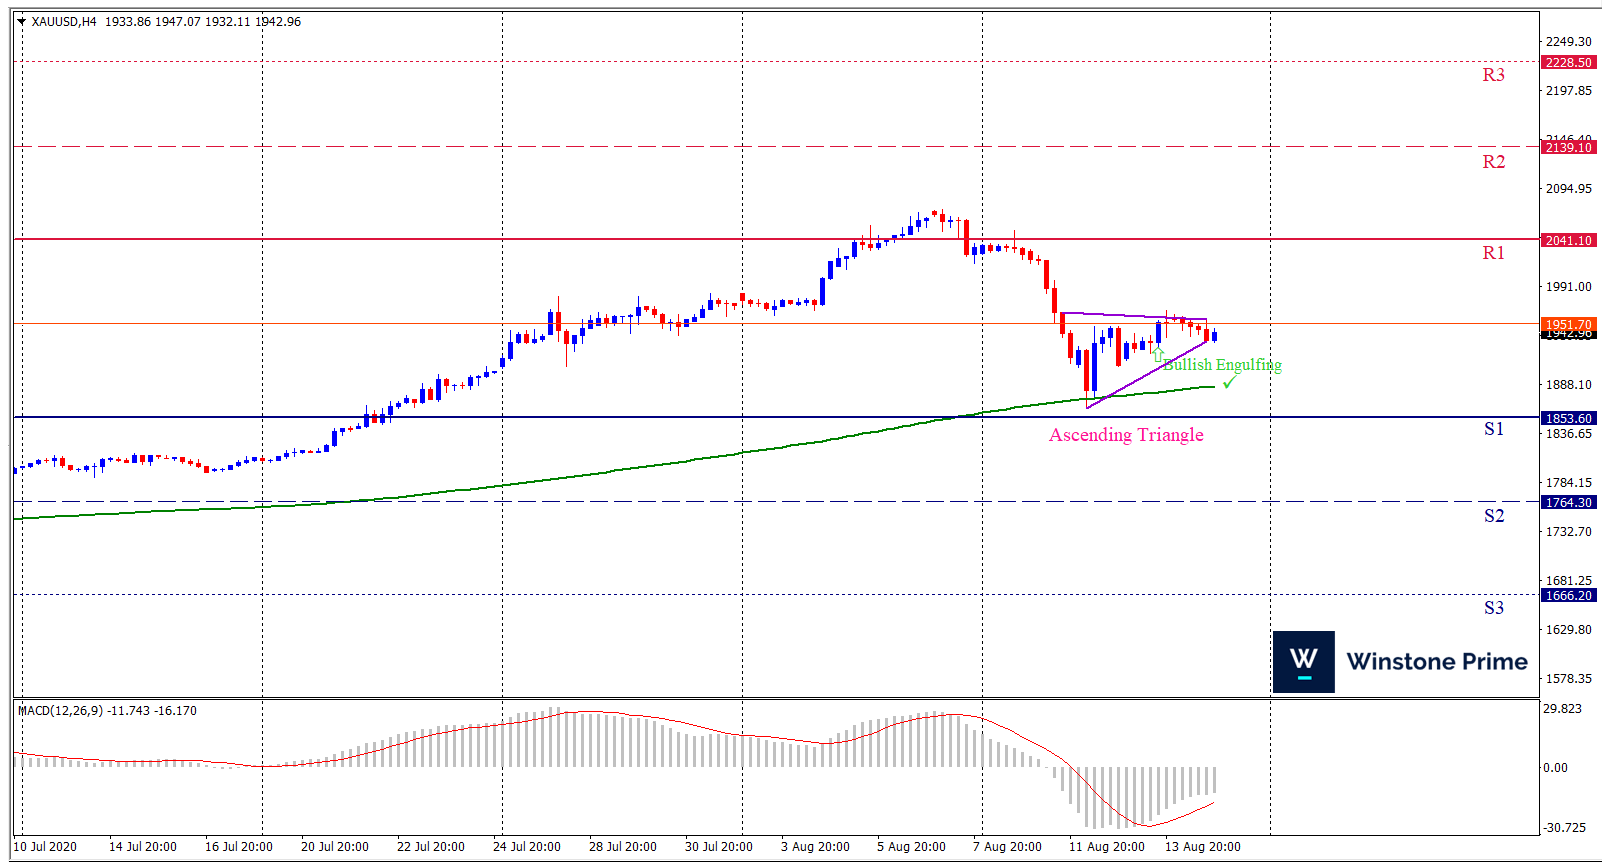
Last week’s high was 1.10% higher than the previous week. Maintaining high at 2049.8 and low at 1862.4 showed a movement of 1874 pips.

In the upcoming week we expect XAU/USD to show a bullish trend.  The Instrument is trading above the 200 Simple Moving Average and the MACD trades to the upside. A solid breakout above 2041.1 may open a clean path towards 2139.1 and may take a way up to 2228.5. Should 1853.6 prove to be unreliable support, the XAUUSD may sink downwards 1764.3 and 1666.2 respectively. In H4 chart Ascending Triangle breakout favors prospects of a bullish trend. Also to be noted Bullish engulfing formation exerts the expectation of uptrend for the pair.

Preference
Buy: 1926.5 target at 2040.5 and stop loss at 1879.2


Alternate Scenario
Sell:  1879.2 target at 1794.8 and stop loss at 1926.5

AUD/USD Weekly Forecast (17th August 2020 – 21st August 2020)

Fundamental view:

Aussie showed a mixed trend for the past week. Investors were less interested in the greenback, affected by the lack of progress in Congress related to a stimulus aid package and tensions with China. Both issues moved to the background these last few days pressurizing Aussie. However ban on Tiktok at the end of the week supported dollar.

US JOLTS Job Openings on 10th August, US Core PPI monthly report on 11th August pushed the pair downwards whereas Australia Unemployment Rate on 13th August and US Core Retail Sales monthly report favored upward trend for the pair.

The major economic events deciding the movement of the pair in the next week are RBA Monetary Policy Meeting Minutes at Aug 18, US Crude Oil Inventories, FOMC Meeting Minutes, OPEC-JMMC Meetings at Aug 19, Australia Flash Manufacturing PMI and Unemployment Claims at Aug 20.

AUD/USD Weekly outlook:

Technical View:

Last week’s high was 0.74% lower than the previous week. Maintaining high at 0.7189 and low at 0.7109 showed a movement of 81 pips.

In the upcoming week we expect AUD/USD to show a bearish trend.  The currency pair is trading above the 100 Simple Moving Average and the MACD trades to the downside. A solid breakout below 0.7124 may open a clean path towards 0.7076 and may take a way down to 0.7044. Should 0.7205 prove to be unreliable resistance, the AUDUSD may raise upwards 0.7237 and 0.7285 respectively. In H4 chart, if breakout of the Symmetrical triangle is to the downside then bearish expectation is favored. Also to be noted doji formation exerts the expectation of downtrend for the pair.

Preference
Sell: 0.7156 target at 0.7075 and stop loss at 0.7206


Alternate Scenario
Buy:  0.7206 target at 0.7279 and stop loss at 0.7156

US Unemployment claims strengthens Dollar

In US, First-time claims for unemployment insurance last week fell below 1 million for the first time since March 21 in a sign that the labor market is continuing its recovery from the corona virus pandemic.

The total claims of 963,000 for the week ended Aug. 8 were well below the estimate of 1.1 million. That represented a decline of 228,000 from the previous week’s total.

“The labor market continues to improve, but unemployment remains a huge problem for the U.S. economy,” wrote Gus Faucher, chief economist at PNC Financial Services. “The number of people filing for unemployment insurance, both regular and PUA benefits, continues to steadily decline as layoffs abate. But job losses remain extremely elevated, far above their pre-pandemic level.” The Unemployment reports adds strength to dollar.

A key eurozone interbank money-market rate is trading below the European Central Bank’s own official rate for the first time in over five months, an indicator that the vast amount of cash that has been poured into the system to combat the COVID-19 crisis. The ECB has flooded the system with so much liquidity that the rate at which banks borrow from each other – Euro Interbank Offer Rate (Euribor) –  is a record low.

Three-month Euribor was trading on Wednesday at minus 0.486%, and in what is a rare occurrence and this rate is now below the ECB’s own euro overnight indexed swap (OIS), which was trading at minus 0.47%.

Three-month Euribor was trading on Wednesday at minus 0.486%, and in what is a rare occurrence – this rate is now below the ECB’s own euro overnight indexed swap (OIS), which was trading at minus 0.47%.

Peter Chatwell, head of rates at Mizuho said “The system is so flooded with liquidity that banks are essentially telling you they don’t need the money.”

EUR/USD 4 Hour Chart:

Support: 1.1767 (S1), 1.1722 (S2), 1.1674 (S3).

Resistance: 1.1861 (R1), 1.1909 (R2), 1.1954 (R3).

Favorable unemployment claim acts as a catalysts for building confidence among investors towards Dollar against Euro. We expect a bearish trend for EUR/USD.

Positive node in UK House pricing creates optimism among Investors

UK house prices turn in to positive territory for the first time since March. Across the UK in aggregate, a net balance of 12 percent of respondents to the Royal Institution of Chartered Surveyors’ monthly survey reported an increase in house prices during July. This was a noticeable turnaround from minus 13 percent in June, as UK house prices rose in virtually all regions.

Simon Rubinsohn, RICS’s chief economist, said surveyors were more cautious about the outlook in the medium term with the economy expected to recover only slowly from its record second-quarter crash and finance minister Rishi Sunak’s property tax cut set to vanish in April.

“Significantly, some contributors are now even referencing the possibility of a boom followed by a bust,” he said.

“Policymakers must ensure that young people’s incomes are protected in the wake of the coronavirus crisis, and that their competitive advantage as first-time buyers is maintained when the stamp duty holiday comes to an end,” policy analyst Lindsay Judge said.

Talking about trade, Brexit jitters continue with fisheries and the level-playing field is the latest challenge. The negotiators will resume the sixth round in the next week. The US criticized the European Union (EU) over its inaction concerning the airbus case while adding some French and German goods to the tariff list and removing a few from the UK and Greece.

On the other hand, US Senators refrain from picking the pace on stimulus talks. Further, some diplomats from the Trump administration and US President Donald Trump criticized China while ordering a showcase of stealth bombers near Vietnam.

GBP/USD 4 Hour Chart:

Support: 1.3003 (S1), 1.29723 (S2), 1.2940 (S3).

Resistance: 1.3065 (R1), 1.3097 (R2), 1.3128 (R3).

UK House price creates a positive outlook for sterling against Dollar. We expect a bullish trend for Cable (GBP/USD).