Australia’s Wage Price Index impacts Aussie

After being the household spending being hit, Australian wages grew at their slowest pace on record in the second quarter.

The official wage price index (WPI) rose 0.2% in the three months to the end of June. That was below the already subdued 0.3% forecast and the 0.5% growth seen in the previous quarter.

The Private sector rose 1.7% over the twelve months to the June quarter 2020. The Public sector rose 2.1% over the twelve months to the June quarter 2020. Both the Private and Public sector annual growth is the lowest record since 1997.

Annual wage growth slowed to 1.8%, well below the levels that used to be considered standard for the country. Both annual and quarterly wage growth were the weakest since records began in September 1997.

Andrew Tomadini, head of price statistics at the ABS said that “The data marked the first full period that captured the impact of COVID-19-driven social and business restrictions”.  “The fall in private sector wages is mainly due to a number of large wage reductions across senior executive and higher paid jobs,” Tomadini noted.

“Looking ahead, wages growth is likely to remain very weak given the collapse in employment and the depressed economic environment,” said Sarah Hunter, chief economist, at BIS Oxford Economics.

In the meantime, US yields are rising in the USD-positive manner. Notably, the 10-year yield jumped by most in over two months on Tuesday as investors sold bonds in anticipation of a surge in debt issuance by the US government and American corporations. A record $38 billion bond auction is due on Wednesday.

In addition, gold, one of Australia’s top exports, fell by most in seven years on Tuesday, having recently rallied to a record high of $2,081.

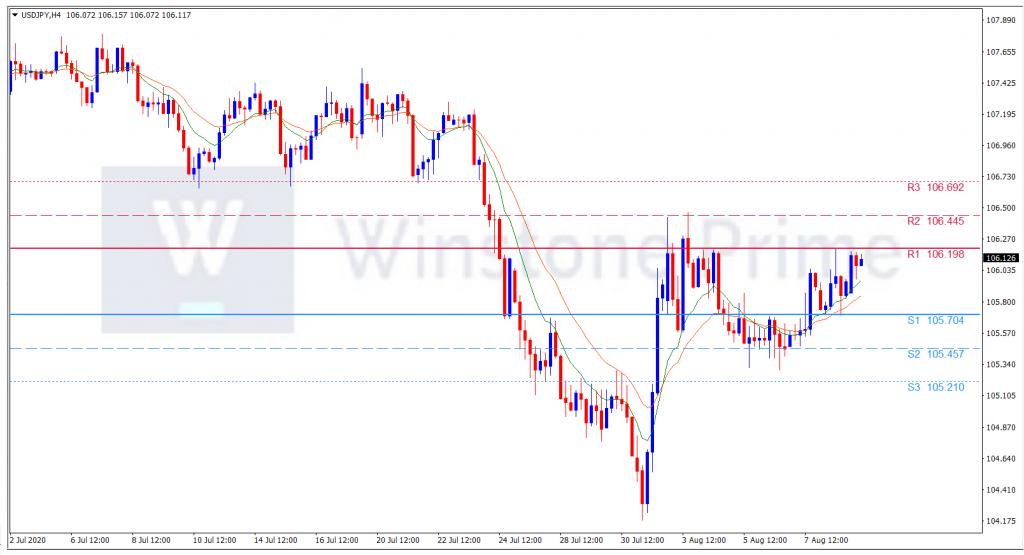
AUD/USD 4 Hour Chart:

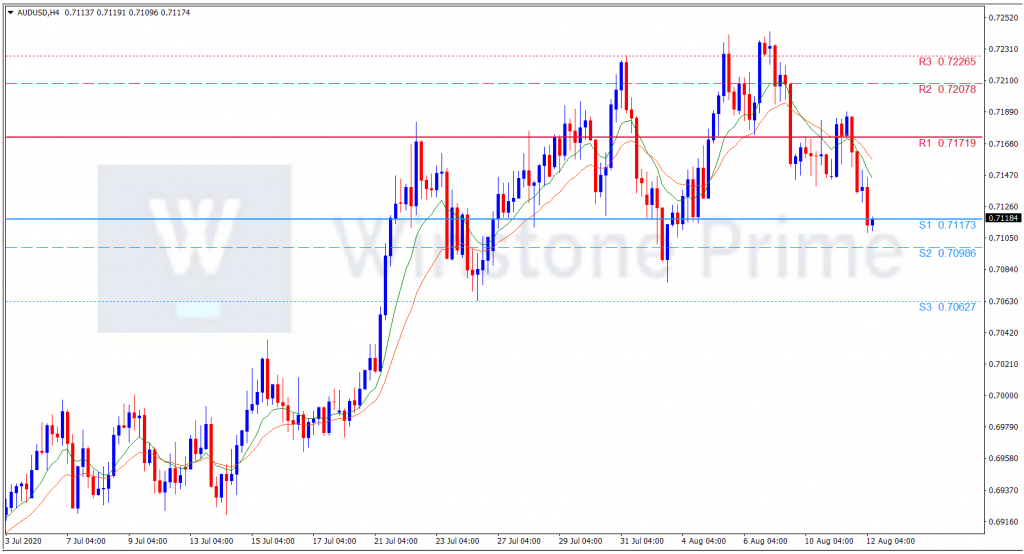
Support:  0.7117 (S1), 0.7099 (S2), 0.7063 (S3).

Resistance: 0.7172 (R1), 0.7208 (R2), 0.7227 (R3).

Recent data shows that consumer confidence and business conditions were hit badly in Australia and hence we expect a bearish trend for AUD/USD.

Multi-Timeframe with Trend line Trading Strategy

This is a price action trading strategy called the Multi-Timeframe Trading with Trend line Trading Strategy and 123 Pattern. It is a strategy complimentary to the trend line trading strategy and to understand the concept of what we are about to show you here, you need to think in terms of multi-timeframe trading.

Multi-timeframe trading :

It simply means a combination of timeframes to watch for a setup and the actual trade will be placed in a smaller timeframe chart.

Now, the chart below shows a trend line trading strategy sell setup that would have fetched hundreds of profitable pips very easy.

But notice the timeframe, It’s in 4hr timeframe.

During that 4hr timeframe, what happened in the 15 minute timeframe or the 5 minute timeframe!

4 Hours Timeframe: 

15 Minute Timeframe :

5 Minute Timeframe :

sometimes if we are unsure if price will break the trend line and go up (or down), then using this trading technique will at least allow you to have a lot more confidence when the breakout happens at point  2 where you either sell or buy.

 Trading Rules :

  • Watch a trend line trading setup happening in a larger timeframe, for example, 4hr, and then when price hits that trend line you switch to a much smaller timeframe to see if you can spot a 123 pattern
  • Once you see the 123 pattern forming and if it’s a sell trade setup, you place your sell stop – 1-2 pips under the low of point 2.
  • If it’s a buy trade, you place a buy stop order above the high of point 2.
  • Your stop loss will be above/below point 1.
  • Take profit target can be 3 times what you risked or using previous swing high (for buy order) or low (for sell order).


Pros :

  • A solid price action strategy that stands the test of time.
  • Good risk reward ratio and can make your hundreds of pips a month easily when the market conditions are perfect.
  • Stop loss most times are placed at ideal locations ( below the support and resistance levels) making sure that you get less chance of being stopped out.
  • Helps you from trading a false trend line trading setups with the addition of the 123 pattern.


Cons :

  • Typically using 3 Different times frames can give a better perspective on the Market activity, but if a trader uses more than 3 different time frames then he may often get confused and not clarity.
  • Some strategies may not be suited for multi time frame.

Deteriorating Japan Export report pressurizes yen

Japan’s current account surplus shrank 31.4 percent in the first half of 2020 from a year earlier to 7.31 trillion yen ($69 billion), marking the lowest level in over five years as exports and spending by visitors from overseas were hit hard by the corona virus pandemic, government data showed.

While the actual figure bettered the median forecast for a JPY 110 billion surplus, it marked a significant deterioration from a JPY 1.177 trillion surplus in May. The current account has posted monthly surpluses for six straight years.

 Exports plunged 25.7% in June from a year ago, having declined by 28.9% in May, while imports dropped an annual 14.4%, following a 27.7% annual fall in May. Primary income, which reflects returns on overseas investments, posted a surplus of 10.43 trillion yen, down 4.0 percent.

In June, the country had a goods trade deficit of 77.3 billion yen and a services trade deficit of 157.7 billion yen, both in the red for the third straight month. Primary income logged a surplus of 426.4 billion yen, down 5.8 percent.

On the other hand, US President Donald Trump’s executive orders recently renewed the strength of the U.S. dollar following the embargo on Dictok and Wechad, joining sanctions on 11 Chinese diplomats, and opening up the benefits of unemployment claims along with other domestic assistance. Further in favor of the Green Pack is the hope that the much-anticipated hopes of a US-China war and trillions of US stimuli will soon be out.

China retaliated to the US moves of sanctioning their policymakers by increasing hardships for 11 American diplomats. However, the Yi Gang, PBOC Governor says “China will continue implementing the phase-one economic and trade agreement with the United States, while measures announced to open up china’s financial sector will continue.” And US President Trump said that China phase one deal means “very little” to him.

The corona virus (COVID-19) infections in Japan is escalating. “Japan’s total corona virus cases topped 50,000 Monday with 836 new cases reported, increasing by 10,000 in just one week, as urban centers including Tokyo and Osaka continue to see high levels of infections since the central government fully lifted the nationwide state of emergency in late May.,” said Japan’s Kyodo news.

USD/JPY 4 Hour Chart:

Support: 105.70 (S1), 105.46 (S2), 105.21 (S3).

Resistance: 106.20 (R1), 10.45 (R2), 106.69 (R3).

As US gains strength against weakening JPY, we expect a bullish trend for USD/JPY.

Release of US Non-farm payroll strengthens Dollar

USD became stronger, assisted by a stronger-than-expected nonfarm payrolls release. The escalated US-China tension is also grows creating a concern around the investors. As previously foreshadowed, Trump announced an executive order on Friday that would ban Tik Tok in the US in 45 days time. Unexpectedly, the executive order also singled out instant messaging app WeChat, owned by Chinese tech giant Tencent.

US nonfarm payrolls was stronger than market expectations, with almost 1.8 million new jobs created in July and the unemployment rate falling by more than expected.  Both the unemployment rate (at 10.2%) and underemployment rate (at 16.5% from 18% in June) remain at very high levels and higher frequency data suggest the labour market recovery has lost some momentum over the past month. 

The upside results of payroll and more cautious market sentiment, after Trump’s announcement on WeChat, resulted in a broad-based USD appreciation.

Adding to the optimism, Trump said those on unemployment benefits would receive an extra $400 per week until early December, down from the previous $600 per week supplementary payment, and he would defer payroll taxes until the end of the year for those earning less than $100,000.  75% of the funding for the unemployment benefits extension is due to come from a disaster recovery fund, with states providing the remaining 25%.  Usually, Congress, which is held by the Democrats, would need to approve spending decisions and Trump’s announcement may result in legal challenges.

As far as Kiwi is concerned, ANZ Business Confidence has deteriorated 10 points to -42.4% in August from July’s -31.8. Meanwhile, Activity Outlook for August slipped by 8 points to -17%. And the central bank is expected to keep rates unchanged at 0.25% until March. However, it may boost or extend asset purchases to push down borrowing costs.

NZD/USD 4 Hour Chart:

Support: 0.6561 (S1), 0.6524 (S2), 0.6459 (S3).

Resistance: 0.6663 (R1), 0.6728 (R2), 0.6765 (R3).

Amidst all the catalysts strengthening Dollar against Kiwi we expect a bearish trend for NZD/USD.