USD/JPY Weekly Forecast (10th August 2020 – 14th August 2020)

Fundamental view:

Japan Prelim GDP quarterly report, Final Manufacturing PMI on 3rd Aug and favored bearish environment for the pair whereas US Final Manufacturing PMI, Construction Spending monthly report on 3rd Aug, Construction Spending monthly report on 3rd Aug and US Unemployment Claims on 6th Aug created a bullish move

US Non-Farm Employment Change released last week was favorable for USD. Last week USD/JPY showed a bullish trend.

The major economic events deciding the movement of the pair in the next week are Japan Bank Lending yearly report at Aug 10, Japan Economy Watchers Sentiment, US Core PPI monthly report at Aug 11, US Core CPI monthly report at Aug 12, US Unemployment Claims at Aug 13, US Core Retail Sales monthly report at Aug 14.

USD/JPY Weekly outlook:

Technical View:

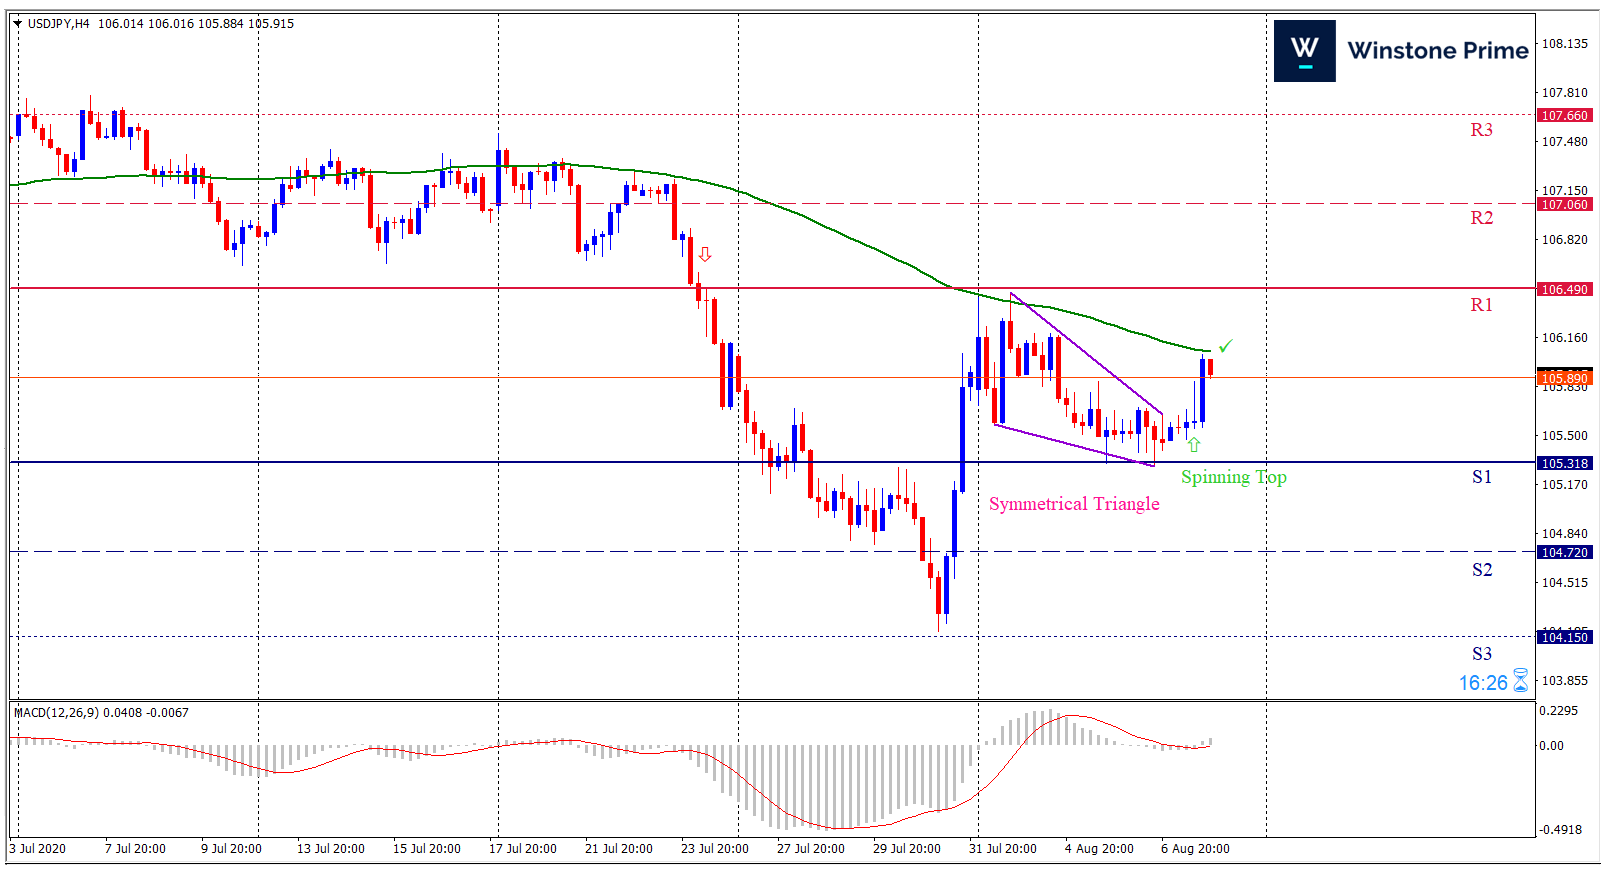
Last week’s high was 0.39% higher than the previous week. Maintaining high at 106.47 and low at 105.30 showed a movement of 117 pips.

In the upcoming week we expect USD/JPY to show a bullish trend. The currency pair is trading below the 100 Simple Moving Average and the MACD trades to the upside. A solid breakout above 106.49 may open a clean path towards 107.06 and may take a way up to 107.66. Should 105.32 prove to be unreliable support, the USDJPY may sink downwards 104.72 and 104.15 respectively. In H4 chart, Breakout of the Symmetrical triangle pattern to the upside indicates reversal of the trend creating prospects of a bullish trend Along with a bullish spinning top formation braces our expectation.

Preference
Buy: 105.81 target at 106.86 and stop loss at 105.11


Alternate Scenario
Sell:  105.11 target at 104.14 and stop loss at 105.81

XAU/USD Weekly Forecast (10th August 2020 – 14th August 2020)

Fundamental view:

This week the gold price had been climbing. This week the PMI numbers also impressed, on Monday the ISM Manufacturing PMI for July came in at 54.2 vs expectations of 53.6. Then later on in the week, ISM Non-Manufacturing PMI for the same month beat consensus estimates of 55.0 and hit 58.1. Obviously things are not so rosy in the US overall as the COVID-19 pandemic is still not under control. US President Trump’s answer seems to be a vaccine rather than more lockdowns as he stated one may be available by 3rd November. This is coincidently the same date as the US election. 

We expect the gold to pullback in the upcoming week. By pulling back, it shows signs of exhaustion that clearly is a bit overdue.

The major economic events deciding the movement of the pair in the next week are Core PPI monthly report at Aug 11, Crude Oil Inventories, Core CPI monthly report at Aug 12, Unemployment Claims at Aug 13, Core Retail Sales monthly report at Aug 14 for US.

XAU/USD Weekly outlook:

Technical View:

Last week’s high was 4.47% higher than the previous week. Maintaining high at 2072.7 and low at 1960.5 showed a movement of 1122 pips.

In the upcoming week we expect XAU/USD to show a bearish trend.  The Instrument is trading is trading above the 200 Simple Moving Average and the MACD trades to the downside. A solid breakout below 1970.8 may open a clean path towards 1909.5 and may take a way down to 1858.6. Should 2083 prove to be unreliable resistance, the XAU/USD may raise upwards 2134 and 2195.2 respectively. In H4 chart breakout of a rectangle pattern favors prospects of a bearish trend. Also to be noted bearish spinning top formation exerts the expectation of downtrend for the pair.

Preference
Sell: 2041.8 target at 1951.3 and stop loss at 2088.4


Alternate Scenario
Buy:  2088.4 target at 2185.2 and stop loss at 2041.8

US initial jobless claim braces Dollar against Loonie

On Thursday, the U.S. has provided Initial Jobless Claims and Continuing Jobless Claims reports. Initial Jobless Claims declined to 1.19 million while analysts projected that it will stay above 1.4 million. Continuing Jobless Claims fell from 17 million to 16.1 million. This is better than expected employment reports provided additional support to the U.S. dollar.

The U.S. will also provide several employment reports on Friday. Non-Farm Payrolls report is projected to show that 1.6 million jobs were added in July while the Unemployment Rate is expected to fall from 11.1% in June to 10.5% in July.

Meanwhile, Canada will provide its employment reports for July on Friday. The Employment Change report is projected to show that the economy added 400,000 jobs in July. Unemployment Rate is expected to decline from 12.3% in June to 11% in July.

US President Donald Trump has reimposed a 10% tariff on some Canadian aluminium products. These developments follow the new USMCA trade deal ratified earlier this year that just went into effect this past July. It has to be noted that The Canadian aluminium industry contributes nearly $5-billion to annual GDP, and approximately 75% of production is exported to the United States.

Speaking in Ohio on Thursday, Mr. Trump said the tariffs were necessary to defend the US aluminium industry because Canadian producers had broken their commitment to stop flooding the US market with a cheaper product. The step was “absolutely necessary to defend our aluminium industry,” he said.

USD/CAD 4 Hour Chart:

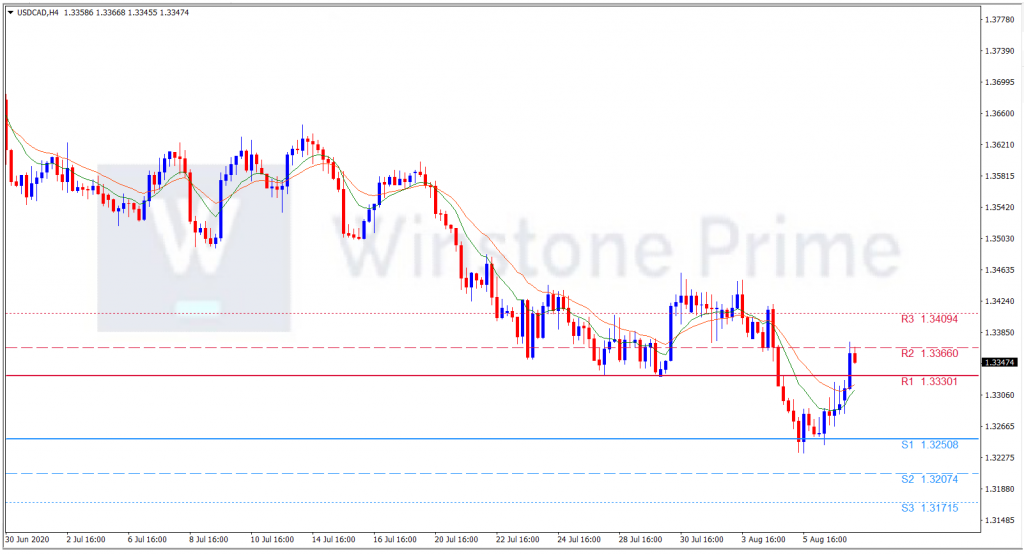
Support: 1.3251 (S1), 1.3207 (S2), 1.3172 (S3).

Resistance: 1.3330 (R1), 1.3366 (R2), 1.3409 (R3).

These news suggest an struggling pace for Loonie, whether the upcoming employment reports of US and Canada later today changes it is yet to be seen. As of now, we expect a bullish trend for USD/CAD.

BoE interest rate prospect favors Sterling

The biggest pound-related news will come today is on the BOE interest rate decision. This meeting comes at a time when the number of corona virus cases in the UK has been falling. It also comes at a time when economic data from the country has been relatively strong. The house price index, mortgage data, retail sales, inflation, and PMIs have beaten analysts forecasts.

The BOE may stress that its figures are only “scenarios” and not forecasts. Nevertheless, figures looking more like a V – or at least a tight Nike swoosh – could be positive for the pound, while a long recovery path could be detrimental to the currency.

Back in June, the BOE announced it is topping up the bond-buying scheme by £100 billion to a total of £745 billion. Members of the Monetary Policy Committee expressed willingness to continue supporting the government’s efforts to stabilize the economy and help it recover.

It is to be noted that meeting comes a month after the bank decided to increase its quantitative easing program by £200 billion.

 Therefore, the central bank will be under no pressure to hike or lower rates or even make any further decisions. Still, analysts will be waiting for direction from Andrew Bailey, the BOE Governor. Among the key issues they will be waiting for are on negative interest rates and yield curve control.

Brexit talks will restart later this month. In these talks, the UK is trying to secure a trade deal with the EU, its biggest trading partner. The stakes of these talks to nowhere is high because of the divergences between the UK and the EU.

 UK is still negotiating with the US and Japan. The two sides that do more than £39.5 billion worth of trade are close to an agreement. The UK department of international said: “Both sides are committed to an ambitious timeline to secure a deal that will enter into force by the end of 2020 if at all possible.” Also, the country is accelerating its talks with the US.

GBP/USD 4 Hour Chart:

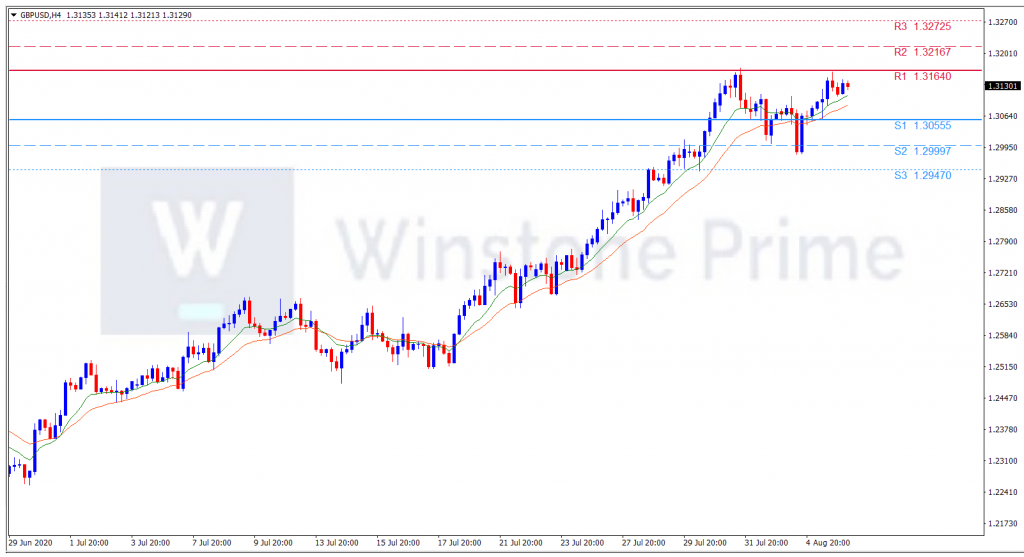
Support: 1.3056 (S1), 1.3000 (S2), 1.2947 (S3).

Resistance: 1.3164 (R1), 1.3217 (R2), 1.3273 (R3).

These catalysts make Sterling is strong against Dollar as of now but Investors remain keen on the BoE Bank rate release for predicting the future direction. We expect a bullish trend for GBP/USD.