London Breakout Trading Strategy

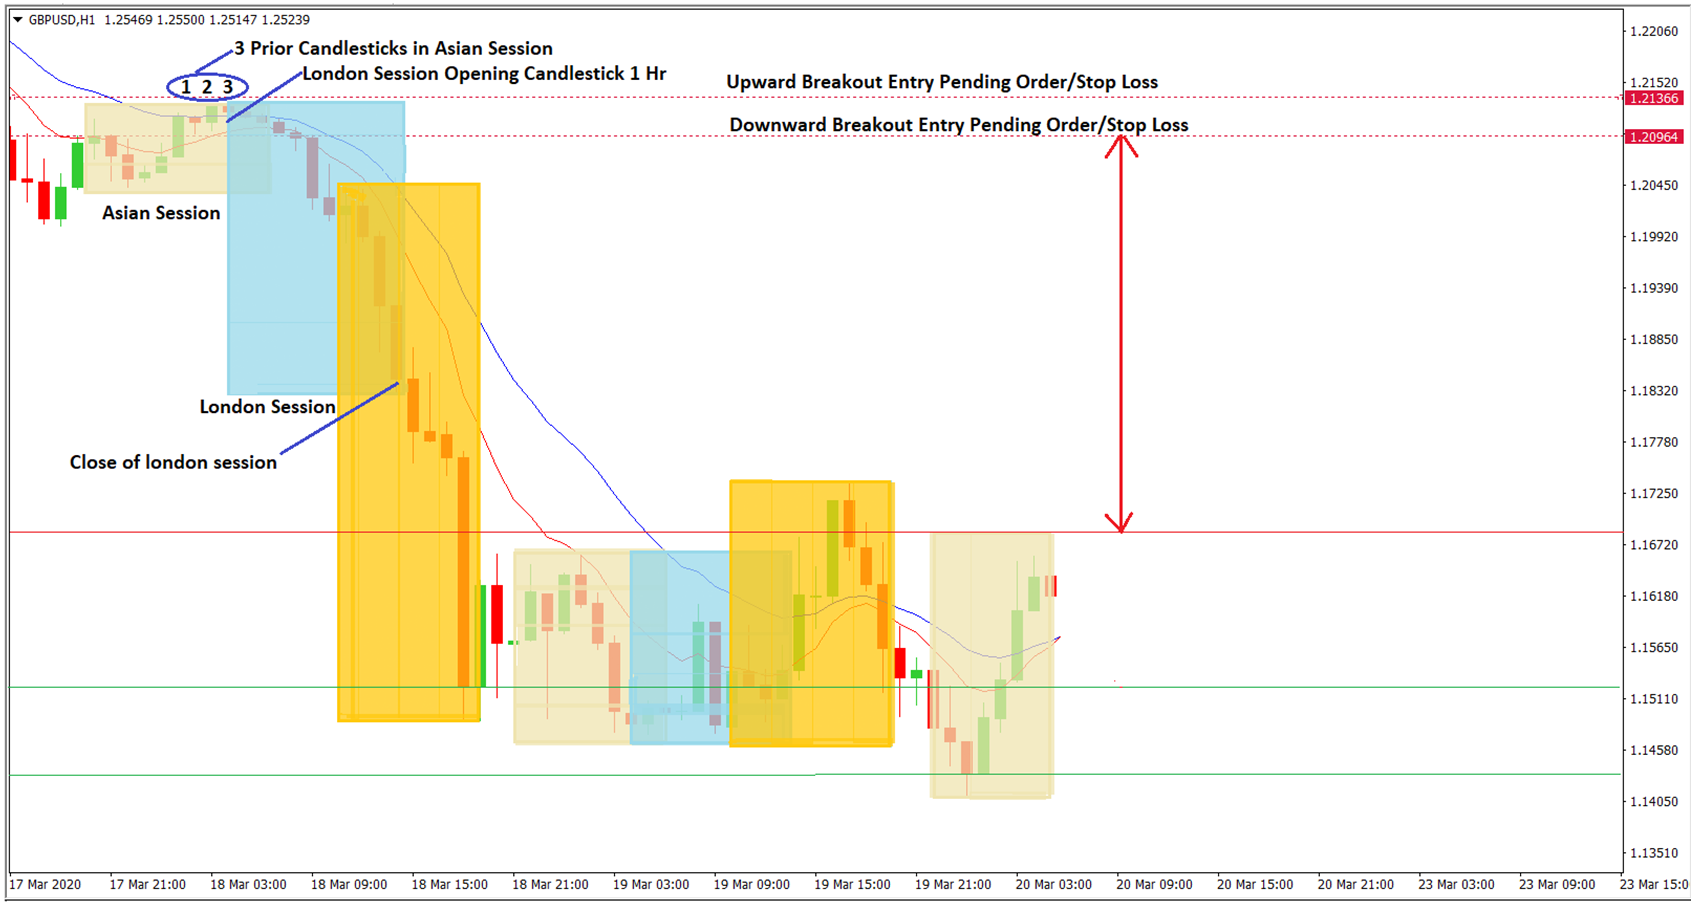
The London breakout trading strategy is used to trade the  London Forex session during the first few hrs (1-3 hrs) when the Forex market opens in London. The London trading session is the biggest Forex market mover as much of the trading volume for currency trading is during this session.

Breakout of last 3 hours of Asian session determines the trend direction of GBPUSD in the London session thus it trend may continue up to US trading session.

“Huge” amount of money and volume of trades are traded in the first few hours of London Forex market and hence creates some exciting trading opportunities. It’s all about catching the trendy move to the upside or downside during the early hours of the London market opening and trading accordingly.

Timeframes :  1 Hour

Currency Pairs : You can use this strategy for Only GBPUSD.

Indicators :  Forex trading session mt4 indicator & Horizontal lines.

This trading strategy works as :

  • Identify the 3 previous candlesticks in the Asian Forex trading session.
  • To form your breakout levels find the high and low of these candlestick .
  • Draw a horizontal line on the highest point of these three candlesticks, If price breaks above this line, it’s a buy signal.
  • Draw another horizontal line on the lowest price point between these 3 candlesticks, If price breaks below this line, this is your sell signal.


Place your breakout orders :

Place two opposite pending orders, a buy stop order and a sell stop order at the same time.

Long Entry :

You need to place buy stop order anywhere from 1-2 pips above the top horizontal line i.e  highest price point of the 3 last Asian session trading candlesticks and its stop loss would be the at least 5 pips below the lower horizontal line.

Short Entry :

You need to place sell stop order 1-2 pips below the low of the lower horizontal line and your stop loss at least 5 pips above the top horizontal line.

Once an order gets activated, cancel the other pending order.

Trade Management :

  • Trail stop to lock in your profits as trade moves in your favor.
  • The first trailing stop technique is by trailing it by “A” pips when price move by “A” pips or some similar variation like, trailing it by “A” pips when price moves by “2A” pips. For example, if price moves by 30 pips, the move trailing stop by 30 pips. Or if price moves by 60 pips then move trailing stop by 30 pips.
  • However, the best trailing stop technique is moving the stop loss behind swing high (or low) point/peaks as price moves in favor the possibility of your trailing stop being hit prematurely is drastically reduced.


Close Trade :

At the end of the London trading session, you must close your trade.  Do not hold it overnight like swing trading strategies.  Just close it even if it mean you have a 10 pips profit or a 10 pips loss. Never hang on your trade hoping for a few more pips in the US trading session.

Pros :

  • Simple and easy Strategy.
  • Simple time breakout strategy does not require any indicators.


Cons :

  • Forex market may not move as expected and this can lead to trading losses.
  • It’s better to avoid trading on Monday and Friday as market usually is slow on Mondays and spikey on Friday’s.  

AUD/USD Weekly Forecast (03rd August 2020 – 07th August 2020)

Fundamental view:

US Durable Goods Orders monthly report on 27th, Australia Trimmed Mean CPI quarterly report on 28th and US Goods Trade Balance on 29th created a bearish move for the pair whereas US S&P/CS Composite-20 HPI yearly report on 28th and Australia Import Prices quarterly report on 29th made a bullish move for the pair.

Prime Minister’s and RBA Assistant Governor’s speech last week favored Aussie and down trending dollar favored a bullish trend last week for the pair.

The major economic events deciding the movement of the pair in the next week are US ISM Manufacturing PMI at Aug 03, RBA Rate Statement at Aug 04, US ISM Non-Manufacturing PMI at Aug 05, US Unemployment Claims at Aug 06, RBA Monetary Policy Statement, and US Average Hourly Earnings monthly report at Aug 07.

AUD/USD Weekly outlook:

Technical View:

Last week’s high was 0.62% higher than the previous week. Maintaining high at 0.7227 and low at 0.7087 showed a movement of 140 pips.

In the upcoming week we expect AUD/USD to show a bearish trend.  The currency pair is trading above the 200 Simple Moving Average and the MACD trades to the downside. A solid breakout below 0.7077 may open a clean path towards 0.7012 and may take a way down to 0.6936. Should 0.7217 prove to be unreliable resistance, the AUDUSD may raise upwards 0.7292 and 0.7087 respectively. In H4 chart, formation of a bearish crab chart favors prospects of a bearish trend. Also to be noted Bearish engulfing formation exerts the expectation of downtrend for the pair.

Preference
Sell: 0.7143 target at 0.7017 and stop loss at 0.7225


Alternate Scenario
Buy:  0.7225 target at 0.7351 and stop loss at 0.7143

EUR/USD Weekly Forecast (03rd August 2020 – 07th August 2020)

Fundamental view:

Fed Announcement at Jul 28 and US CB Consumer Confidence at Jul 28 and EU Prelim Flash GDP at Jul 31 pushed for a bearish trend for the pair whereas German Buba Monthly Report at Jul 27 and US Advance GDP quarterly report at Jul 30 supported Euro and created a bullish trend for the pair, The unfavorable result of US Unemployment Claims at Jul 30 and US Core Durable Goods Orders at Jul 27 supported for a bullish move.

US faced challenges like delay in the much-awaited US corona virus (COVID-19) aid package, the surge in the pandemic which impacted it negatively. Hence EUR/USD showed a bullish trend last week.

The major economic events deciding the movement of the pair in the next week are Europe Final Manufacturing PMI, US ISM Manufacturing PMI at Aug 03, French Gov Budget Balance at Aug 04, US ISM Non-Manufacturing PMI at Aug 05, US Unemployment Claims at Aug 06, and US Average Hourly Earnings monthly report at Aug 07.

EUR/USD Weekly outlook:

Technical View:

Last week’s high was 2.15% higher than the previous week. Maintaining high at 1.1908 and low at 1.1642 showed a movement of 385 pips.

In the upcoming week we expect EUR/USD to show a bearish trend. The currency pair is trading above the 100 Simple Moving Average and the MACD trades to the downside. A solid breakout below 1.1639 may open a clean path towards 1.1507 and may take a way down to 1.1373. Should 1.1906 prove to be unreliable resistance, the EURUSD may raise upwards 1.2040 and 1.2172 respectively. Chart formation of a Bearish crab pattern in H4 chart sets prospects for a bearish trend. Three black crows formation in H4 chart escalates the expectation for a bearish trend.

Preference
Sell: 1.1784 target at 1.1489 and stop loss at 1.1911


Alternate Scenario
Buy:  1.1911 target at 1.2169 and stop loss at 1.1784

XAU/USD Weekly Forecast (03rd August 2020 – 07th August 2020)

Fundamental view:

In the last week, Increased tensions between US and China, Historic EU deal supported gold. Fed’s open door to doing more implies further dollar weakness. Number of new Covid-19 cases weakens dollar and Gold saw the benefit from that. U.S. data showed the deepest economic contraction leading to a bullish move.

We expect the short-term trend to be shaky because traders are going to be a little more cautious as prices straddle the $2000 level hence we expect a bearish move for the instrument in the upcoming week.

The major economic events deciding the movement of the pair in the next week are ISM Manufacturing PMI at Aug 03, ISM Non-Manufacturing PMI, Crude Oil Inventories at Aug 05, Unemployment Claims at Aug 06, Average Hourly Earnings monthly report, and Unemployment Rate at Aug 07 for US.

XAU/USD Weekly outlook:

Technical View:

Last week’s high was 4.06% higher than the previous week. Maintaining high at 1983.9 and low at 1905.3 showed a movement of 786 pips.

In the upcoming week we expect XAU/USD to show a bearish trend.  The Instrument is trading above the 100 Simple Moving Average and the MACD trades to the downside. A solid breakout below 1923.2 may open a clean path towards 1874.9 and may take a way down to 1844.6. Should 2001.9 prove to be unreliable resistance, the XAUUSD may raise upwards 2032.2 and 2080.5 respectively. In H4 chart breakout of a Triple top pattern formation favors prospects of a bearish trend. Also to be noted Spinning top formation exerts the expectation of downtrend for the pair.

Preference
Sell: 1976.2  target at 1925.4 and stop loss at 2004.3


Alternate Scenario
Buy:  2005.1 target at 2058.9 and stop loss at 1962.6