BTC/USD Weekly Forecast (03rd August 2020 – 07th August 2020)

Fundamental view:

In the last week, USD cyclical downturn reinforces Bitcoin rally. Goldman Sachs’ strategists say that U.S. dollar is at risk of losing its status as the world’s reserve currency. Other factors that affect the greenback are the increased political uncertainty and growing concerns of another corona virus infection spike created a favourable environment for Bitcoin. Thus last week showed a bullish move.

The major economic events deciding the movement of the pair in the next week are ISM Manufacturing PMI at Aug 03, ISM Non-Manufacturing PMI, Crude Oil Inventories at Aug 05, Unemployment Claims at Aug 06, Average Hourly Earnings monthly report, and Unemployment Rate at Aug 07 for US.

 BTC/USD Weekly outlook:

Technical View:

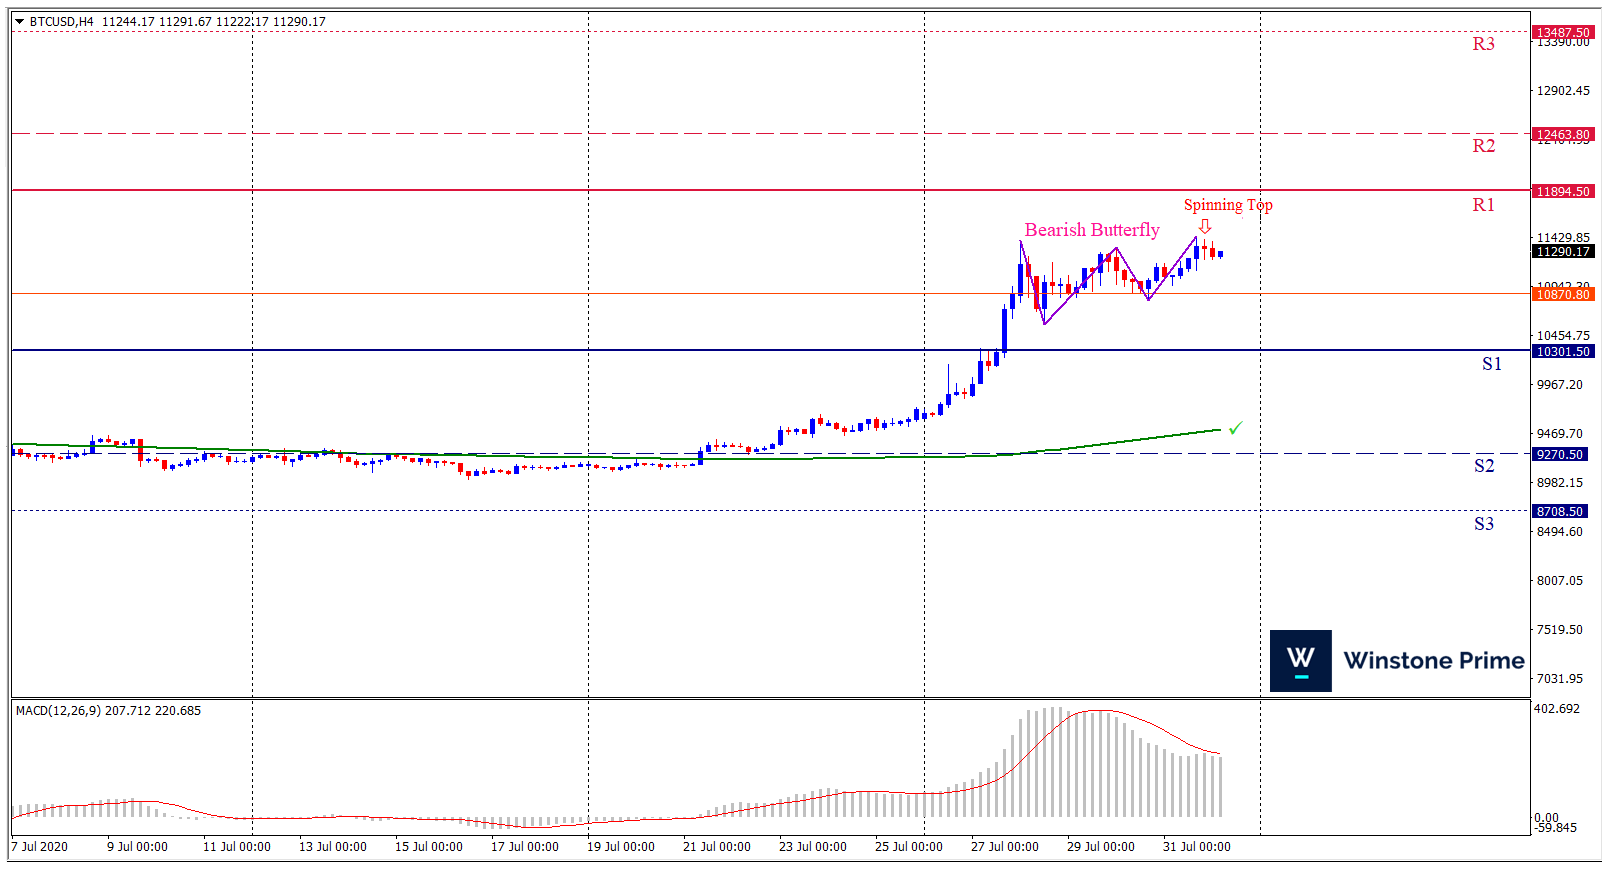
Last week’s high was 15.58% higher than the previous week. Maintaining high at 11746.1 and low at 9847.2 showed a movement of 1593 pips.

In the upcoming week we expect BTC/USD to show a bearish trend.  The Instrument is trading above the 200 Simple Moving Average and the MACD trades to the downside. A solid breakout below 10301.5 may open a clean path towards 9277.8 and may take a way down to 8708.5. Should 11894.5 prove to be unreliable resistance, the BTCUSD may raise upwards 12463.8 and 13487.5 respectively. In H4 chart, formation of Bearish Butterfly and Spinning top constructs a bearish outlook for the pair in the upcoming week.

Preference
Sell:  11777.6 target at 11068.3  and stop loss at 12274.0


Alternate Scenario
Buy:  12274.0 target at 12893.9 and stop loss at 11777.6

GBP/USD Weekly Forecast (03rd August 2020 – 07th August 2020)

Fundamental view:

UK M4 Money Supply monthly report on 29th, US Goods Trade Balance on 29th US Core Durable Goods Orders monthly report created bearish move for the pair whereas UK CBI Realized Sales on 28th, US CB Consumer Confidence on 28th created favorable environment for GBP and favored a bullish trend for the pair.

US- Sino tension along with the delay in the election in US also made an impact in the greenback negatively created a bullish trend last week.

The major economic events deciding the movement of the pair in the next week are UK Final Manufacturing PMI, US ISM Manufacturing PMI at Aug 03, US ISM Non-Manufacturing PMI at Aug 05, BOE Monetary Policy Report, US Unemployment Claims at Aug 06, and US Average Hourly Earnings monthly report at Aug 07.

GBP/USD Weekly outlook:

Technical View:

Last week’s high was 2.86% higher than the previous week. Maintaining high at 1.3170 and low at 1.2784 showed a movement of 385 pips.

In the upcoming week we expect GBP/USD to show a bearish trend.  The currency pair is trading above the 100 Simple Moving Average and the MACD trades to the downside. A solid breakout below 1.2854 may open a clean path towards 1.2626 and may take a way down to 1.2469. Should 1.3239 prove to be unreliable resistance, the GBPUSD may raise upwards 1.3397 and 1.3625 respectively. Chart formation of Bearish ABCD pattern in H4 chart favors prospects of a bearish trend. Bearish Engulfing formation escalates the expectation for a bearish trend.

Preference
Sell: 1.3094 target at 1.2846 and stop loss at 1.3215


Alternate Scenario
Buy:  1.3215 target at 1.3514 and stop loss at 1.3094

USD/JPY Weekly Forecast (03rd August 2020 – 07th August 2020)

Fundamental view:

US Crude Oil Inventories on 29th, US Advance GDP quarterly report on 30th, US Personal Spending monthly report and Chicago PMI on 31st made the pair move upwards whereas US Core Durable Goods Orders monthly report on 27th July, Japan Retail Sales yearly report on 29th and US S&P/CS Composite-20 yearly report on 28th July created bearish move for the pair.

Japan’s plan of releasing several estimates for its economic growth in fiscal 2020 and 2021 because of the uncertainty over the corona-virus pandemic favours Yen hence USD/JPY showed a bearish trend last week.

The major economic events deciding the movement of the pair in the next week are Japan Final Manufacturing PMI, US ISM Manufacturing PMI at Aug 03, BOJ Gov Kuroda Speaks, US ISM Non-Manufacturing PMI at Aug 05, Japan Average Cash Earnings yearly report, US Unemployment Claims at Aug 06, and US Average Hourly Earnings monthly report at Aug 07.

USD/JPY Weekly outlook:

Technical View:

Last week’s high was 1.38% lower than the previous week. Maintaining high at 106.05 and low at 104.18 showed a movement of 187 pips.

In the upcoming week we expect USD/JPY to show a bullish trend. The currency pair is trading below the 200 Simple Moving Average and the MACD trades to the upside. A solid breakout above 106.59 may open a clean path towards 107.26 and may take a way up to 108.46. Should 104.72 prove to be unreliable support, the USDJPY may sink downwards 103.52 and 102.85 respectively. In H4 chart, Formation of Broadening Wedges pattern indicates reversal of the trend creating prospects of a bullish trend Along with a bullish engulfing formation braces our expectation.

Preference
Buy: 105.70 target at 10710 and stop loss at 104.99


Alternate Scenario
Sell:  104.99 target at 103.28 and stop loss at 105.70

The negative sentiment for greenback favors the yellow metal

US is facing several challenges like delay in the much-awaited US corona virus (COVID-19) aid package, the surge in the pandemic, and delay in American Presidential Election and devastating GDP figures which makes dollar to struggle.

As of July 30, more than 4.5 million cases have been confirmed in the U.S., There have been more than 150,000 deaths. The latest virus update from the US suggests that Texas marked the record deaths of 322 with a 62% rise in hospitalization on Thursday. US President Donald Trump showed worries for the rapid increase but refrained from entertaining the case of a long-term shutdown.

Trump seeks to delay the elections, alleging that the universal mail-in voting system would be ripe with fraud and that the elections should be held when it is safe to do so.  Trump said in his tweet that, “With Universal Mail-In Voting (not Absentee Voting, which is good), 2020 will be the most INACCURATE & FRAUDULENT Election in history. It will be a great embarrassment to the USA. Delay the Election until people can properly, securely, and safely vote???”

Furthermore, the US Senate members are showing mixed signs concerning the trillion-dollar worth fiscal package as the White House Chief of Staff Mark Meadows recently said that he is not even optimistic about any bill in the near-term.

Real gross domestic product (GDP) decreased at an annual rate of 32.9 percent in the second quarter of 2020, according to the “advance” estimate released by the Bureau of Economic Analysis. In the first quarter, real GDP decreased by 5.0 percent.

Gold prices ease to $1,957 during the early Asian session on Friday. The quote managed to portray the first negative daily closing in 10-days on Thursday 1955.9. But the yellow metal managed to rise by Friday. And to be noted US dollar index (DXY) drop to the fresh low since May 2018.

XAU/USD 4 Hour Chart:

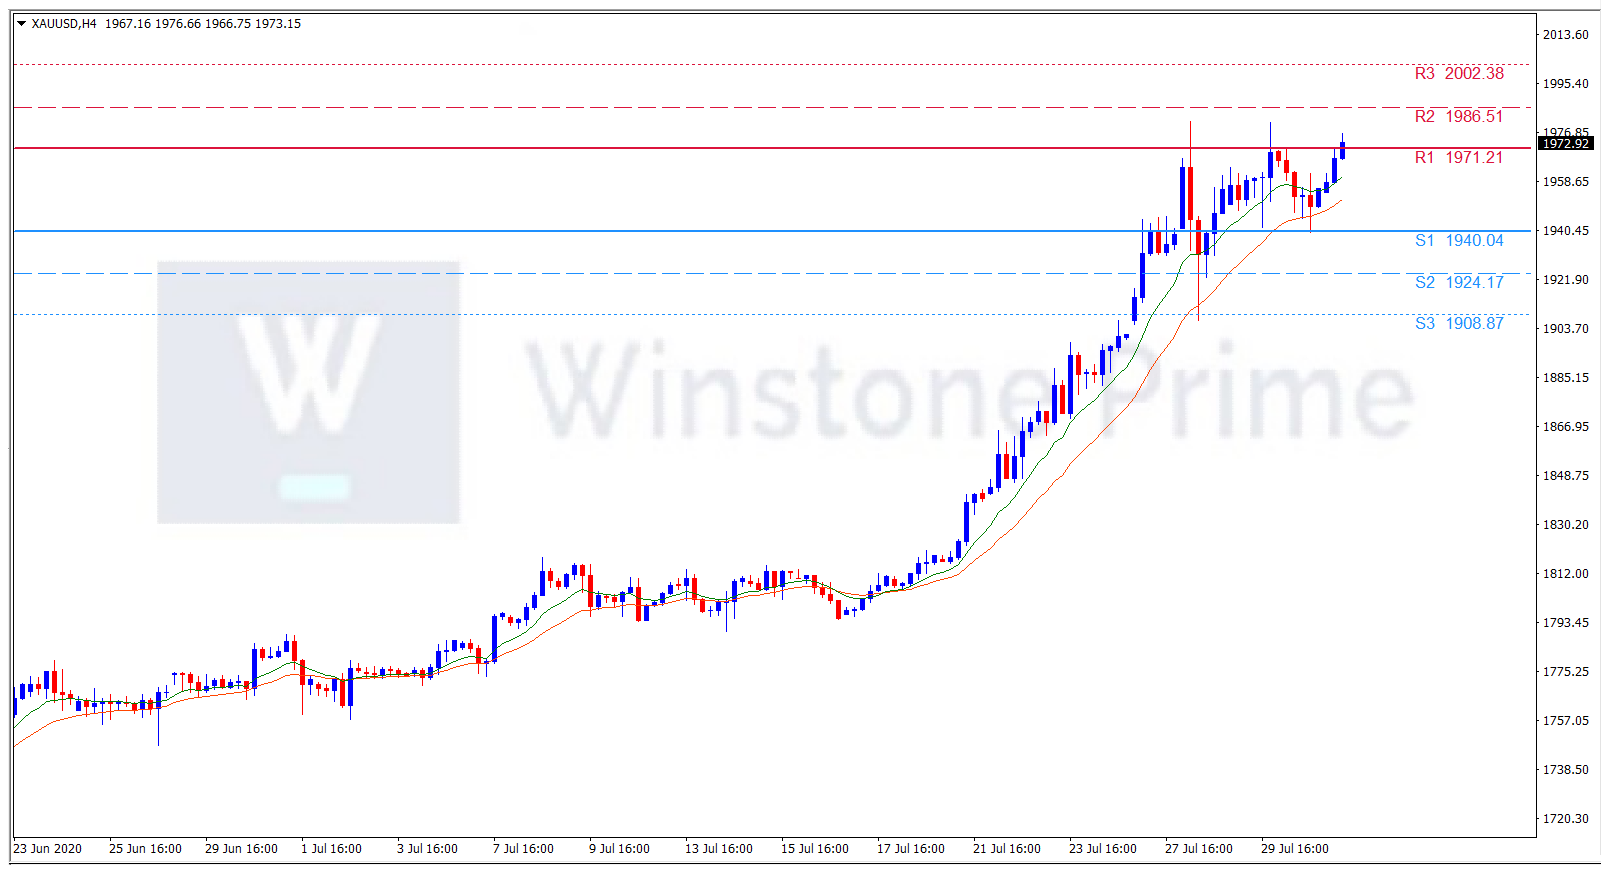
Support: 1940 (S1), 1924.2 (S2), 1908.9 (S3).

Resistance: 1971.2 (R1), 1986.5 (R2), 2002.4 (R3).

In the prevailing negative atmosphere for US Dollar, The yellow metal gains strength. We expect a bullish move for XAU/USD.