The best Forex Indicator will be the one that suits your own trading style and psychology. However, there is no single Forex best indicator that fits all trader styles. The good news is there is a wide variety of technical indicators available. With time and experience, you should be able to find the right indicators for you.
Forex technical indicators consist of mathematical calculations that forex traders often use based on the exchange rate, volume or open interest of a currency pair. Technical traders who operate in the stock market typically look at the price of a stock, but forex traders look at the exchange rate of a currency pair. The majority of the major forex indicators are computed from exchange rates.
Here we are going to see 5 major and commonly used indicators:
- Bollinger Bands
- MACD
- Parabolic SAR
- Stochastic
- Relative Strength Index (RSI)
Bollinger Bands
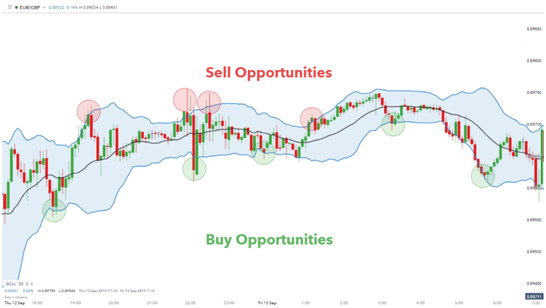
Bollinger bands are used to measure the market’s volatility. They act like mini support and resistance levels.
Bollinger Bounce
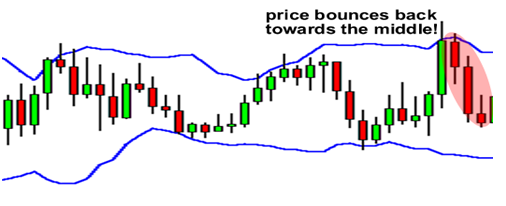
- A strategy that relies on the notion that price tends to always return to the middle of the Bollinger bands.
- You buy when the price hits the lower Bollinger band.
- You sell when the price hits the upper Bollinger band.
- Best used in ranging markets.
Bollinger Squeeze
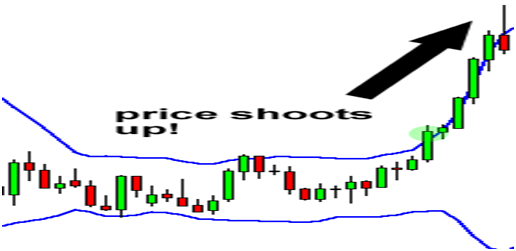 A strategy that is used to catch breakouts early.
- When the Bollinger bands “squeeze”, it means that the market is very quiet, and a breakout is imminent. Once a breakout occurs, we enter a trade on whatever side the price makes its breakout.
PARAMETERS: (30,2,2)
RULES: Cover and go long when daily closing price crosses below lower band. Cover and go short when daily closing price crosses above upper band.
Find the Bollinger Bands indicator chart below:
MACD
MACD is an acronym for Moving Average Convergence Divergence.
This indicator is a tool that’s used to identify moving averages that are indicating a new trend, whether it’s bullish or bearish.
MACD is used to catch trends early and can also help us spot trend reversals.
PARAMETERS: (12,26,9)
RULES: Cover and go long when MACD1 (fast) crosses above MACD2 (slow). Cover and go short when MACD1 crosses below MACD2.
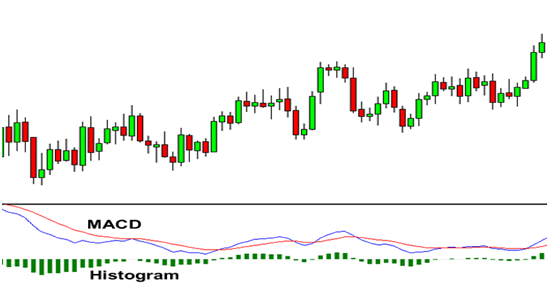
It consists of 2 moving averages (1 fast, 1 slow) and vertical lines called a histogram, which measures the distance between the 2 moving averages.
- Contrary to what many people think, the moving average lines are NOT moving averages of the price. They are moving averages of other moving averages.
- MACD’s downfall is its lag because it uses so many moving averages.
- One way to use MACD is to wait for the fast line to “cross over” or “cross under” the slow line and enter the trade accordingly because it signals a new trend.
Find the MACD indicator chart below:
Parabolic SAR
This indicator is made to spot trend reversals, hence the name Parabolic Stop And Reversal (SAR).
This is the easiest indicator to interpret because it only gives bullish and bearish signals.
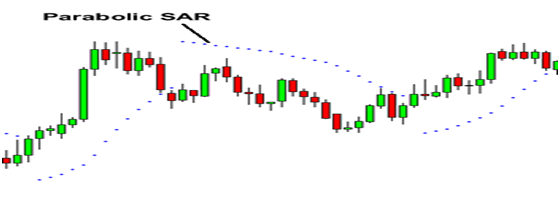
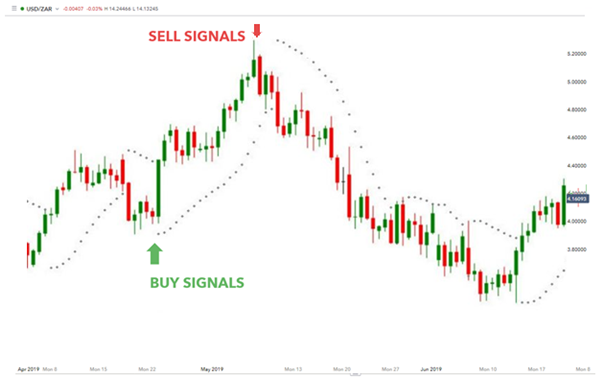
- When the dots are above the candles, it is a sell signal.
- When the dots are below the candles, it is a buy signal.
- These are best used in trending markets that consist of long rallies and downturns.
PARAMETERS: (.02,.02,.2)
RULES: Cover and go long when daily closing price crosses above Parabolic SAR. Cover and go short when daily closing price crosses below Parabolic SAR.
The nice thing about the Parabolic SAR is that it is really simple to use. We mean REALLY simple.
Basically, when the dots are below the candles, it is a BUY signal.
When the dots are above the candles, it is a SELL signal.
Find the Parabolic SAR indicator chart below:
Stochastic
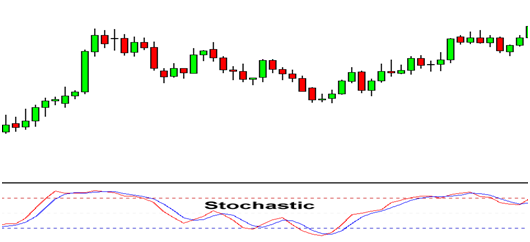
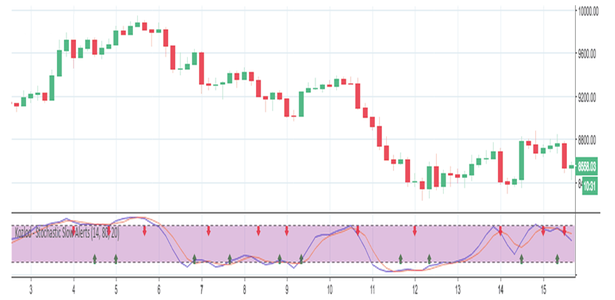
The Stochastic oscillator is another technical indicator that helps traders determine where a trend might be ending.
PARAMETERS: (14,3,3)
RULES: Cover and go long when Stoch % crosses above 20. Cover and go short when Stoch % crosses below 80.
- Used to indicate overbought and oversold conditions.
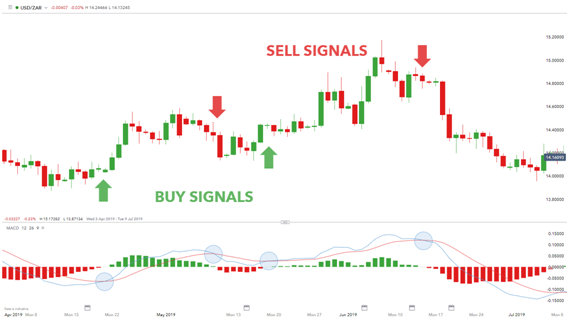
- When the moving average lines are above 80, it means that the market is overbought and we should look to sell.
- When the moving average lines are below 20, it means that the market is oversold and we should look to buy.
Find the Stochastic indicator chart below:
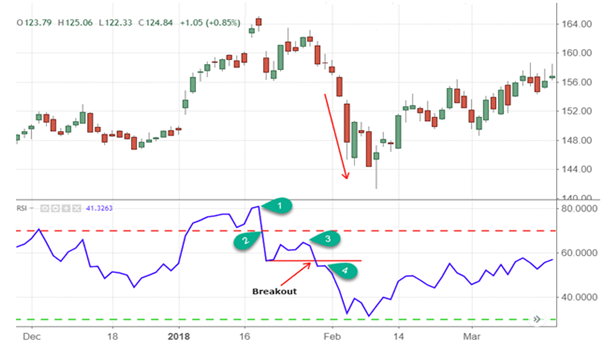
Relative Strength Index (RSI)
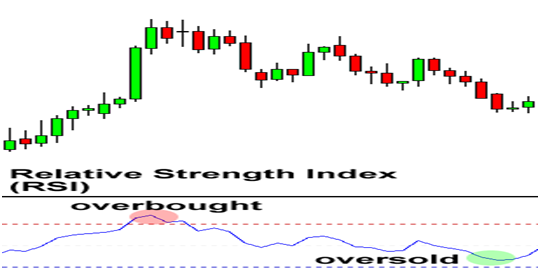
RSI is similar to Stochastic in that it identifies overbought and oversold conditions in the market.
PARAMETERS: (9)
RULES: Cover and go long when RSI crosses above 30. Cover and go short when RSI crosses below 70
- Similar to the stochastic in that it indicates overbought and oversold conditions.
- When RSI is above 70, it means that the market is overbought and we should look to sell.
- When RSI is below 30, it means that the market is oversold and we should look to buy.
- RSI can also be used to confirm trend formations. If you think a trend is forming, wait for RSI to go above or below 50 (depending on if you’re looking at an uptrend or downtrend) before you enter a trade.
Find the Stochastic RSI indicator chart below:

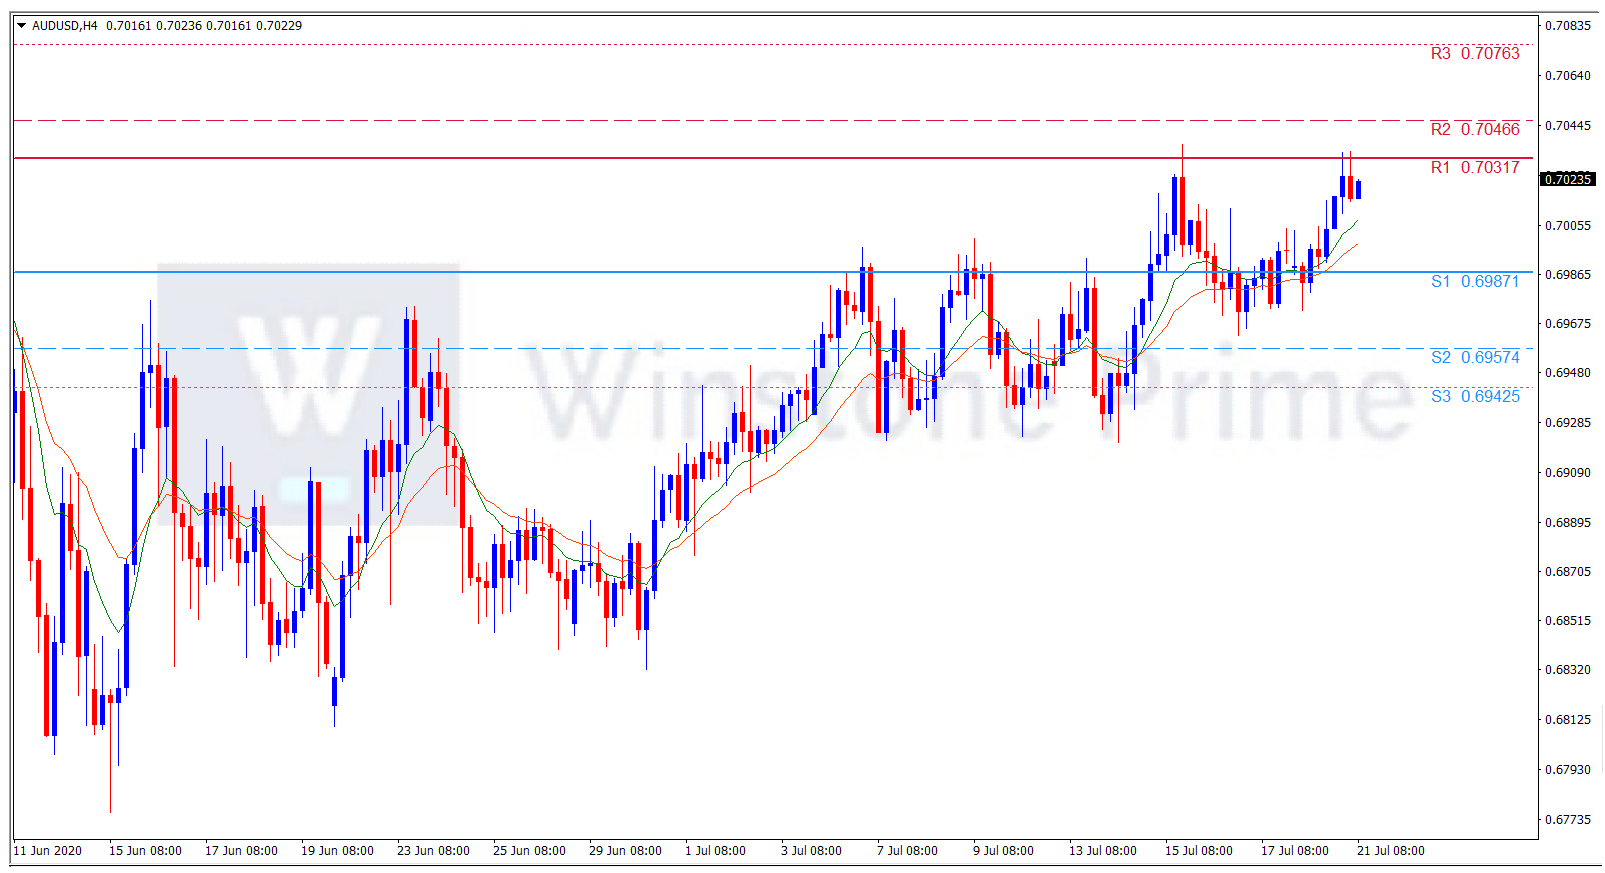
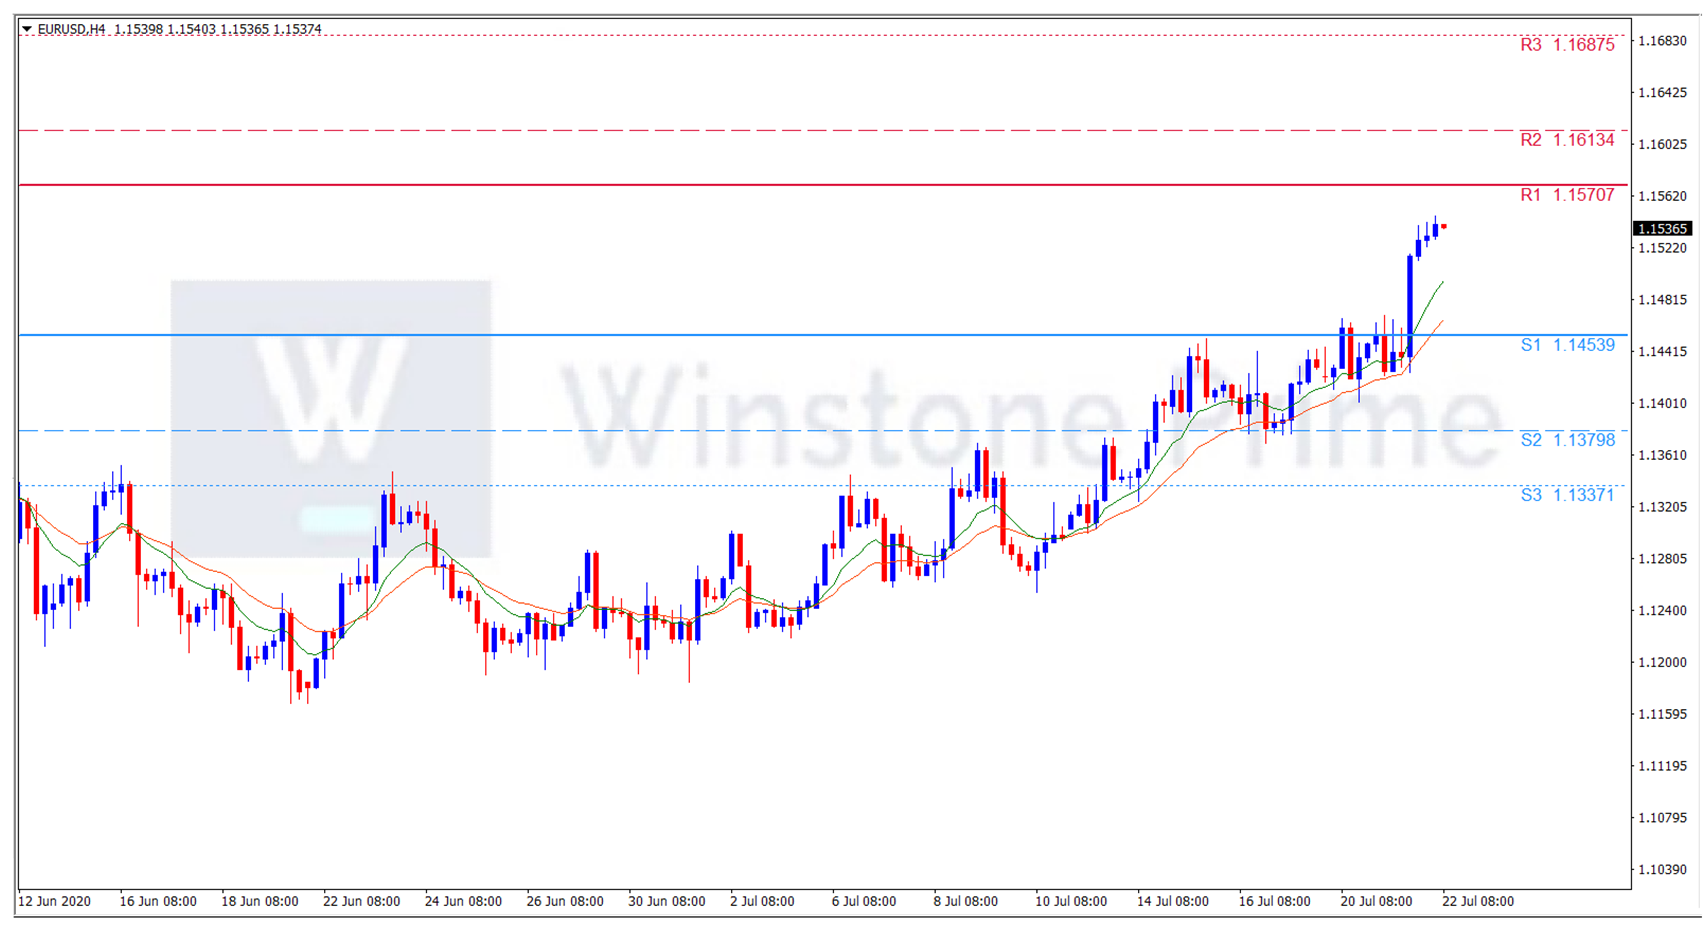 Support: 1.1454 (S1), 1.1380 (S2), 1.1337 (S3).