BTC/USD Weekly Forecast (07th February 2022 – 11th February 2022)

Fundamental view:

Bitcoin edged higher against the US dollar during the trading course of the week. The broad US dollar weakness and the threat of rising inflation are the major catalysts in the bullish move of the quote BTC/USD. US policymaker’s hesitance on rate hike along with weak US ADP data weighed on the US dollar during the first half of the week but strong NFP data on Friday helped the greenback. ADP showed a report that the employment in the private sector had declined from 301,000 in January which raised concerns over worsening conditions in the US labour market. However, On Friday, the US Bureau of Labor Statistics (BLS) announced that Nonfarm Payrolls increased by 467,000 in January, surpassing the market expectation of 150,000.  The Unemployment Rate ticked higher to 4%, while the Participation Rate jumped to 62.2%, and signaled quite a healthy recovery in the sector.

Other recent catalysts also helped the oldest crypto currency – Bitcoin. A bill previously introduced by Washington Representative Suzan DelBene aimed to exempt crypto users from paying taxes on transactions under $200. Elsewhere, Robert Kiyosaki, the highly successful author of the “Rich Dad Poor Dad” series of personal finance books, has suggested that the flagship cryptocurrency bitcoin ($BTC) is part of the path to “financial heaven,” along with precious metals gold and silver. Moreover, the underlying strength of Bitcoin as an asset remains strong – it is still the best performing financial instrument of the past 11 years.

The major economic events deciding the movement of the pair in the next week are EIA Crude Oil Stocks Change, WASDE Report at Feb 09, Initial Jobless Claims, Federal Budget Balance at Feb 10 and Michigan Consumer Sentiment at Feb 11 for US.  

BTC/USD Weekly outlook:

Technical View:


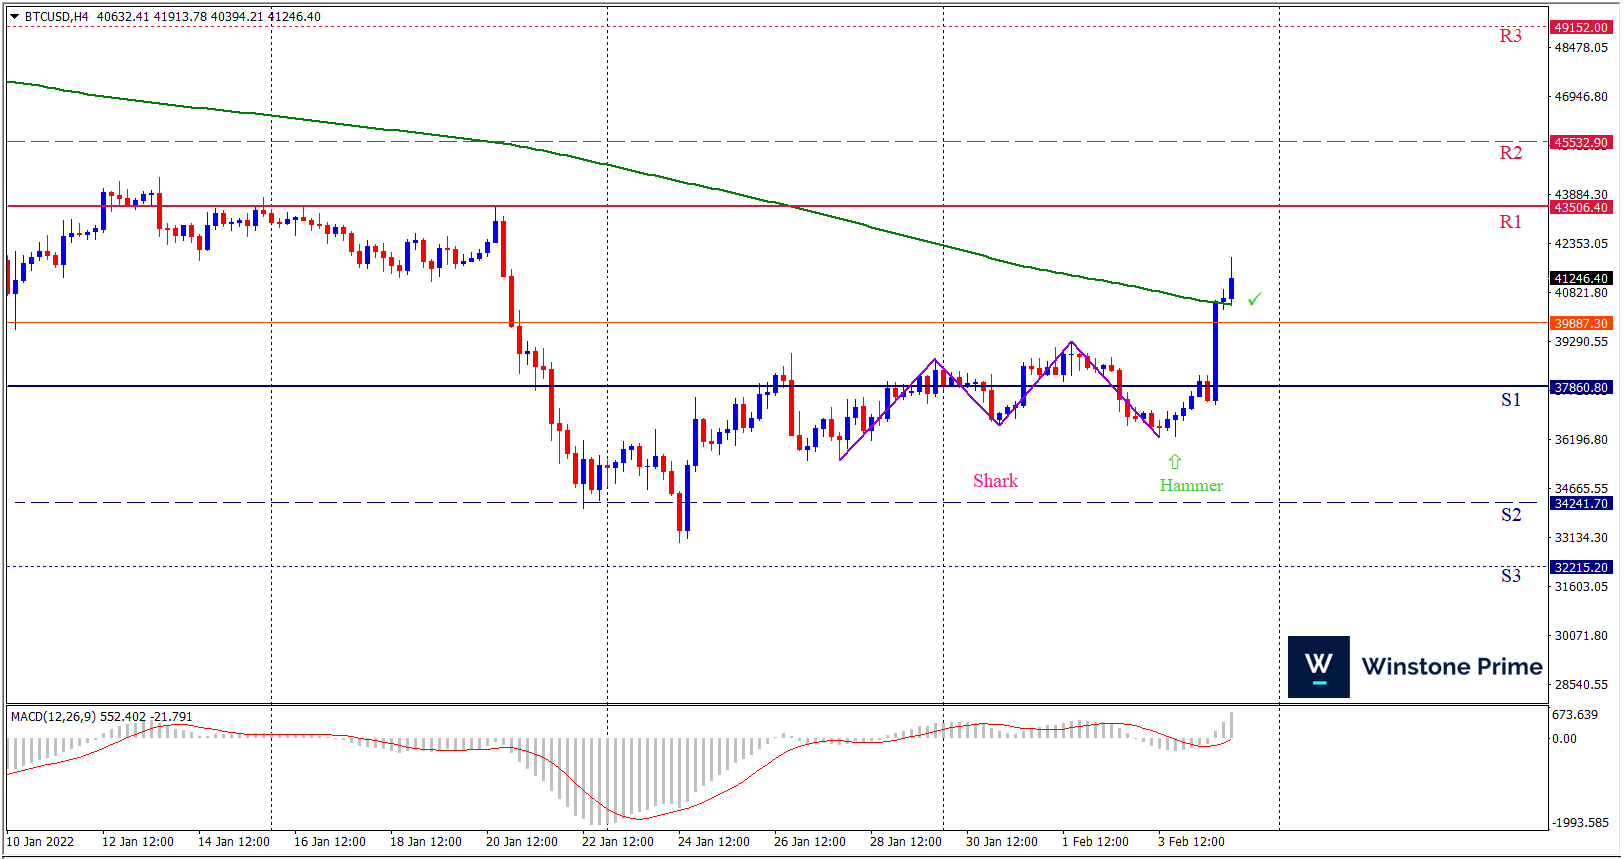
Last week’s high was 7.16% higher than the previous week. Maintaining high at 41913.8 and low at 36268.2 showed a movement of 5645 pips.

In the upcoming week we expect BTC/USD to show a bullish trend. The Instrument is trading above the 200 Simple Moving Average and the MACD trades to the upside. A solid breakout above 43506.4 may open a clean path towards 45532.9 and may take a way up to 49152.0. Should 37860.8 prove to be unreliable support, the BTCUSD may sink downwards 34241.7 and 32215.2 respectively. In H4 chart bullish shark pattern formation favors prospects of a bullish trend. Hammer pattern constructs a bullish outlook for the pair in the upcoming week.

Preference
Buy: 41277.2 target at 46876.9 and stop loss at 37855.8


Alternate Scenario
Sell: 37855.8 target at 32216.6 and stop loss at 41277.2

XAU/USD Weekly Forecast (07th February 2022 – 11th February 2022)

Fundamental view:

The yellow metal rebounded after a sharp fall of the previous week. The broad US dollar weakness and downbeat US ADP report favored the Gold to find strength during the first half of the week later the strong NFP data of US paused the bullish move of the quote XAU/USD. ADP showed a report that the employment in the private sector had declined from 301,000 in January which raised concerns over worsening conditions in the US labour market. Elsewhere, The BOE hiked its policy rate by 25 bps to 0.5% following the February policy meeting. The policy statement revealed that four members of the Monetary Policy Committee voted for a 50 bps rate hike. And the European Central Bank President Lagarde had a hawkish stance this week, She did not repeat her previous comment that interest rates were not likely to increase in 2022 when asked about it. The Hawkish stance from ECB and BOE also helped the yellow metal to climb higher against the greenback.

On Friday, the US Bureau of Labor Statistics (BLS) announced that Nonfarm Payrolls increased by 467,000 in January, surpassing the market expectation of -192000.  The Unemployment Rate ticked higher to 4%, while the Participation Rate jumped to 62.2%, and signaled quite a healthy recovery in the sector. Additionally, the December print got revised higher to 510,000 from 199,000. NFP data helped the US dollar and didn’t allow the yellow metal to find bullish momentum.

The major economic events deciding the movement of the pair in the next week are EIA Crude Oil Stocks Change, WASDE Report at Feb 09, Initial Jobless Claims, Federal Budget Balance at Feb 10 and Michigan Consumer Sentiment at Feb 11 for US. 

XAU/USD Weekly outlook:

Technical View:

Last week’s high was 2.13% lower than the previous week. Maintaining high at 1814.9 and low at 1785.5 showed a movement of 294 pips.

In the upcoming week we expect XAU/USD to show a bullish trend. The Instrument is trading below the 200 Simple Moving Average and the MACD trades to nearly neutral. A solid breakout above 1819.8 may open a clean path towards 1832.1 and may take a way up to 1849.2. Should 1790.4 prove to be unreliable support, the XAUUSD may sink downwards 1773.3 and 1761.0 respectively. In H4 chart bullish shark pattern favors prospects of a bullish trend. Also to be noted hammer formation exerts the expectation of uptrend for the pair.

Preference
Buy: 1807.5 target at 1835.8 and stop loss at 1785.7


Alternate Scenario
Sell: 1785.7 target at 1762.4 and stop loss at 1807.5

AUD/USD Weekly Forecast (07th February 2022 – 11th February 2022)

Fundamental view:

Australian dollar traded high against the US dollar and partially recovered its previous week losses and ended around 0.7050 level. The uptrend of the pair can be related to the broad US dollar weakness and the rate hike from BOE and hawkish monetary policy from ECB. US central bank’s policymaker’s hesitance on the rate hike along weak US ADP data weighed on the US dollar.

On the other hand, The Reserve Bank of Australia decided to maintain rates at record lows and kept the monetary policy unchanged in its February meeting. The statement published by the end of the week showed that “the Board judged that it is too early to conclude that inflation is sustainably in the target range,” And this dovish stance prevented the AUD/USD rally despite the broad dollar’s weakness. However, the favorable NFP data showing a record of 457k which is triple of 150 which is very high than the expectation of -192k helped the US dollar to gain strength on Friday.

In this week, Commonwealth Bank Manufacturing PMI on 1st February and Nonfarm Payrolls on 4th February favored bearish trend whereas Australia Home Loans monthly report on 1st February, US ADP Nonfarm Employment Change on 2nd February and Australia Building Approvals monthly report on 3rd February favored bullish trend for the pair.

The major economic events deciding the movement of the pair in the next week are Australia Retail Sales quarterly report at Feb 07, Australia NAB Business Confidence at Feb 08, US EIA Crude Oil Stocks Change, US WASDE Report at Feb 09, RBA Governor Lowe Speech, Initial Jobless Claims, Federal Budget Balance at Feb 10 and Michigan Consumer Sentiment at Feb 11.  

AUD/USD Weekly outlook:

Technical View:

Last week’s high was 0.28% lower than the previous week. Maintaining high at 0.7167 and low at 0.6985 showed a movement of 182 pips.

In the upcoming week we expect AUD/USD to show a bullish trend. The currency pair is trading below the 200 Simple Moving Average and the MACD trades to the downside. A solid breakout above 0.7160 may open a clean path towards 0.7255 and may take a way up to 0.7342. Should 0.6978 prove to be unreliable support, the AUDUSD may sink downwards 0.6891 and 0.6796 respectively. In H4 chart, Formation of bullish alt bat pattern indicates reversal of the trend creating prospects of a bullish trend Along with a bullish harami formation braces our expectation.

Preference
Buy: 0.7078 target at 0.7254 and stop loss at 0.6973


Alternate Scenario
Sell: 0.6973 target at 0.6795 and stop loss at 0.7078

USD/JPY Weekly Forecast (07th February 2022 – 11th February 2022)

Fundamental view:

US dollar traded low against the Japanese yen during the first four trading days but bounced up on Friday with surprise NFP data. The Bank of England and the European Central Bank hawkish stance on rate hike made their currencies stronger against the US dollar. USD/JPY reached its week’s low on Wednesday after BoE meeting and downbeat US ADP data. The Central bank policymaker’s hesitance about the rate hike also weighed on the US dollar. (BoE) raised its Bank Rate 0.25% to 0.5%, its second consecutive increase. Meanwhile, Christine Lagarde, President of the European Central Bank (ECB), provided another surprise when she noted that inflation on the continent had increased and rate hikes this year were not ruled out. Amidst all the catalysts weighing, US dollar had a downtrend.

The Dollar came back on Friday with upbeat NFP data. US managed to add 467K new job positions, which is very high than the expectation of -192k. Meanwhile The Unemployment Rate ticked higher to 4%, while the Participation Rate jumped to 62.2%, signaling quite a healthy recovery in the sector. This helped in the bounce back of the US dollar.

Japan Retail Sales monthly report on 31st January, US Initial Jobless Claims on 3rd February and Nonfarm Payrolls on 4th February created bullish momentum whereas Japan Markit Manufacturing PMI and US ISM Manufacturing PMI on 1st February and US ADP Nonfarm Employment Change on 2nd February created bearish momentum for the pair.

The major economic events deciding the movement of the pair in the next week are BoJ Board Member Nakamura Speech, BoJ Corporate Goods Price Index monthly report, US EIA Crude Oil Stocks Change, US WASDE Report at Feb 09, Initial Jobless Claims, Federal Budget Balance at Feb 10 and Michigan Consumer Sentiment at Feb 11.  

USD/JPY Weekly outlook:

Technical View:

Last week’s high was 0.08% lower than the previous week. Maintaining high at 115.59 and low at 114.15 showed a movement of 144 pips.

In the upcoming week we expect USD/JPY to show a bullish trend. The currency pair is trading above the 200 Simple Moving Average and the MACD trades to the upside. A solid breakout above 115.84 may open a clean path towards 116.43 and may take a way up to 117.28. Should 114.40 prove to be unreliable support, the USDJPY may sink downwards 113.55 and 112.96 respectively. In H4 chart symmetrical triangle pattern breakout upside favors prospects of a bullish trend. Also to be noted three inside up formation exerts the expectation of uptrend for the pair.

Preference
Buy: 115.25 target at 116.42 and stop loss at 114.35


Alternate Scenario
Sell: 114.35 target at 112.97 and stop loss at 115.25