XAU/USD Weekly Forecast (13th July 2020 – 17th July 2020)

Fundamental view:

US Consumer Credit report at 8th July pressurized dollar hence creating bullish trend whereas US IBD/TIPP Economic Optimism report released at 6th July as a catalyst for the uptrend move for dollar and US Unemployment Claims at 9th June 2020 created a favorable atmosphere for USD hence fabricating a bearish trend for the pair. Overall the pair showed a positive nod last week as the worries of rising cases of covid 19 in US made investors away from USD and favored a bullish trend last week. 

The major economic events deciding the movement of the pair in the next week are USD Core Consumer Price Index (CPI) at Jul 14, Crude Oil Inventories, USD Treasury Currency Report at Jul 15, Philly Fed Manufacturing Index, Unemployment Claims at Jul 16, USD Prelim UoM Consumer Sentiment at Jul 17.

Investors should favor stocks and gold over bonds and cash because the latter offer a negative rate of return and central banks will print more money, according to Bridgewater Associates’s Ray Dalio, founder of the world’s largest hedge fund. This recent news creates an uptrend expectation of pair in coming week.

XAU/USD Weekly outlook:

Technical View:

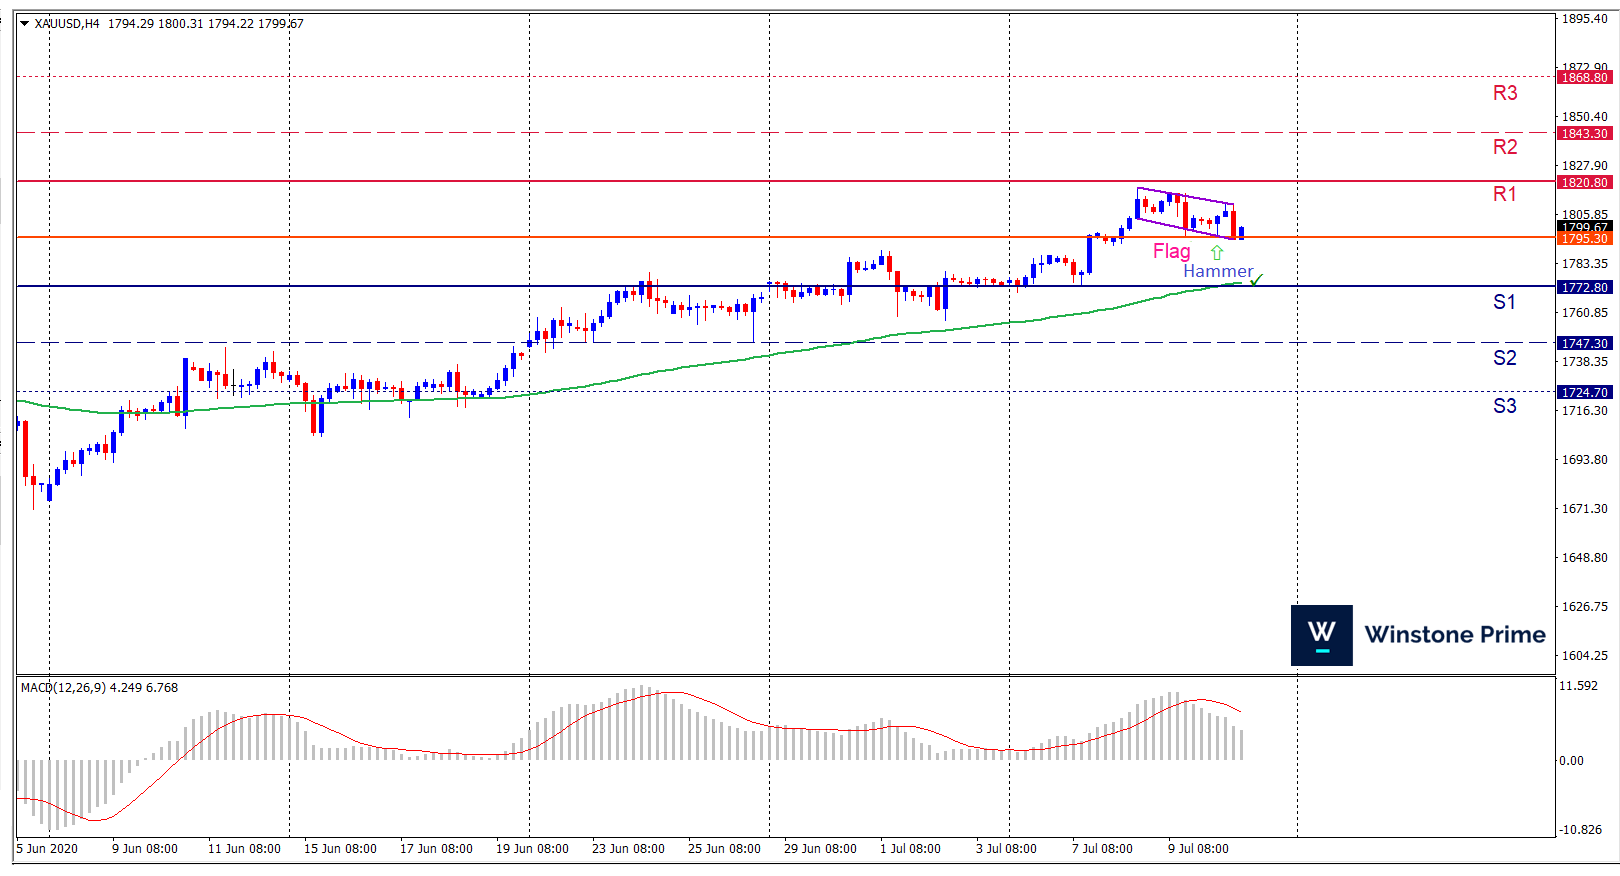
 Last week’s high was 16% higher than the previous week. Maintaining high at 1817.8 and low at 1769.8 showed a movement of 480 pips.

In the upcoming week we expect XAU/USD to show a bullish trend.  The Instrument is trading above the 100 Simple Moving Average and the MACD trades to the downside. A solid breakout above 1820.8 may open a clean path towards 1843.3 and may take a way up to 1868.8. Should 1772.8 prove to be unreliable support, the XAUUSD may sink downwards 1747.3 and 1724.7 respectively. In H4 chart breakout of a flag upside may favor prospects of a bullish trend. Also to be noted bullish hammer formation exerts the expectation of uptrend for the pair.

Preference
Buy: 1805.2 target at 1842.7 and stop loss at 1769.4


Alternate Scenario
Sell:  1769.4 target at 1729.2 and stop loss at 1805.2

GBP/USD Weekly Forecast (13th July 2020 – 17th July 2020)

Fundamental view:

In the past week, US Non-Manufacturing PMI released at 6th July and US Unemployment Rate released at 9th July supported greenback and created a bearish trend for the pair whereas UK Construction PMI favorable release at 6th July and UK Halifax monthly report released at 7th July boosted the pound  and created bullish trend . Also to be noted Reckoning of Brexit talks impacted the pair positively.

Chancellor Rishi  Sunak’s statement portrayed the economic recovery steps taken by UK creating hopes among investors and  the trend showed a bullish view last week.

The major economic events deciding the movement of the pair in the next week are GBP GDP Monthly report, USD Core Consumer Price Index (CPI) at Jul 14, Monetary Policy Report Hearings, USD Treasury Currency Report at Jul 15, USD Unemployment Claims at Jul 16, and GBP Retail Sales monthly report at Jul 17.

GBP/USD Weekly outlook:

Technical View:

Last week’s high was 1.11% higher than the previous week. Maintaining high at 1.2669 and low at 1.2462 showed a movement of 207 pips.

In the upcoming week we expect GBP/USD to show a bearish trend.  While the currency pair is trading above the 100 Simple Moving Average but the MACD trades to the downside.  A solid breakout below 1.2496 may open a clean path towards 1.2374 and may take a way down to 1.2288. Should 1.2704 prove to be unreliable resistance, the GBPUSD may raise upwards 1.2791 and 1.2912 respectively. In H4 Chart, formation of ABCD Pattern favors prospects of a bearish trend as well as Shooting star formation escalates the expectation for a bearish trend.

Preference
Sell: 1.2642 target at 1.2469 and stop loss at 1.2713


Alternate Scenario
Buy:  1.2713 target at 1.2815 and stop loss at 1.2642

BTC/USD Weekly Forecast (13th July 2020 – 17th July 2020)

Fundamental view:

USD ISM Non-Manufacturing PMI at 6th July and US Unemployment Claims at 9th July favored USD and created bearish trend for the pair whereas as IBD/TIPP Economic Optimism at 7th July and US Crude Oil Inventories at 8th July acted as a catalyst for the downtrend move for dollar and boosted Bullish move for the pair in the last week. Amid the negative sentiment for USD last week, BTC/USD portrayed a bullish trend in past week.

The major economic events deciding the movement of the pair in the next week are USD Core Consumer Price Index (CPI) at Jul 14, Crude Oil Inventories, USD Treasury Currency Report at Jul 15, Philly Fed Manufacturing Index, Unemployment Claims at Jul 16, USD Prelim UoM Consumer Sentiment at Jul 17.

Bitcoin was pinched saying that it is still forty percent lower than its 2019 high of $12,943 creates a negative sentiment for Bitcoin.

BTC/USD Weekly outlook:

Technical View:

Last week’s high was 18.3% higher than the previous week. Maintaining high at 9452.5 and low at 8896.3 showed a movement of 556 pips.

In the upcoming week we expect BTC/USD to show a bearish trend. The Instrument is trading above the 100 Simple Moving Average and the MACD trades to the downside. A solid breakout below 8924.8 may open a clean path towards 8632.4 and may take a way down to 8368.6. Should 9481.0 prove to be unreliable resistance, the BTCUSD may raise upwards 9744.8 and 10037.02 respectively. In H4 chart, formation of rising wedge and Bearish Harami constructs a bearish outlook for the pair in the upcoming week.

Preference
Sell: 9168.2 target at 8660.2 and stop loss at 9491.4


Alternate Scenario
Buy: 9491.4 target at 10015.2 and stop loss at 9168.2

EUR/USD Weekly Forecast (13th July 2020 – 17th July 2020)

Fundamental view:

EU Economic Forecasts report of the last week at 7th July 2020 and US Crude Oil Inventories at 8th July acted as a catalyst for the downtrend move for dollar and created a bullish move for the pair whereas USD Unemployment Claims at 9th July created bearish move. The increasing cases of Covid 19 in US have led Greenback to lose its strength which has boosted EUR against USD in the past week.

COVID 19 cases in US has reached 3 million last week which is a setback  on the hopes of economic recovery on the other hand The euro is strengthened by the economic recovery in Europe, lower political risks. Hence EUR/USD showed a bullish trend last week.

The major economic events deciding the movement of the pair in the next week are USD Core Consumer Price Index (CPI) at Jul 14, Euro group Meetings, USD Treasury Currency Report at Jul 15, European Central Bank Press Conference, Unemployment Claims at Jul 16, and USD Prelim UoM Consumer Sentiment at Jul 17.

EUR/USD Weekly outlook:

Technical View:

Last week’s high was 0.60% higher than the previous week. Maintaining high at 1.1370 and low at 1.1241 showed a movement of 129 pips.

In the upcoming week we expect EUR/USD to show a bearish trend. While the currency pair is trading above the 100 Simple Moving Average but the MACD trades to the downside. A solid breakout below 1.1234 may open a clean path towards 1.1171 and may take a way down to 1.1103. Should 1.1365 prove to be unreliable resistance, the EURUSD may raise upwards 1.1433 and 1.1496 respectively. Chart formation of a three drives pattern in H4 chart sets prospects for a bearish trend. Shooting star formation in H4 chart escalates the expectation for a bearish trend.

Preference
Sell: 1.1312 target at 1.1190 and stop loss at 1.1376


Alternate Scenario
Buy:  1.1376 target at 1.1480 and stop loss at 1.1312