Camarilla Pivots is a math-based price action analysis tool that generates potential support and resistance levels, similar to pivot points, using the previous day’s high price, low price and closing price.
US employment claim affirms dollar

Earlier, the U.S. dollar experienced weakness but the scenarios reversed as the market mood was positive following the release of better-than-expected U.S. Initial Jobless Claims. The Initial Jobless Claims report showed that 1.31 million Americans filed for unemployment benefits in a week. Meanwhile, Continuing Jobless Claims dropped to 18.1 million as some workers managed to find new jobs. Another support that escalates demand for the dollar might be the increasing fear of second wave of virus which can trigger to next lock-down making the investors to move to the safe haven asset. Moreover, the U.S. economy added 4.8 million jobs in June, exceeding expectations, and capturing a flurry of rehiring after states lifted stay-at-home orders.
On the other hand, the Canadian dollar found itself under pressure as WTI oil fell. There was no particular catalyst for this move, and it looks like a general virus worries put pressure on oil. Canadian oil benchmarks mostly travel in sync with the leading world benchmarks like Brent and WTI so the downside move of WTI oil is negative for the Canadian dollar.
News poll taken at the end of June found that only 30 percent of Canadians who either lost their job or were working reduced hours because of the pandemic were reemployed or working more. There is only a little change as compared to last week. The latest job posting data from Indeed Canada also reinforce the idea that new hiring stalled in the first week of July. It would be a worrying development that could suggest the disruptions in the job market from the COVID-19 lock-downs are more persistent than expected. Partial recovery of just 30 percent of the three million Canadians who had lost their job has put CAD under more pressure.
“Many of the personal services and accommodation services that have been hit really hard, there’s going to be some reopening effect but it’s going to be far from complete,” said an Indeed economist Brendon Bernand.
USD/CAD 4 Hour Chart:
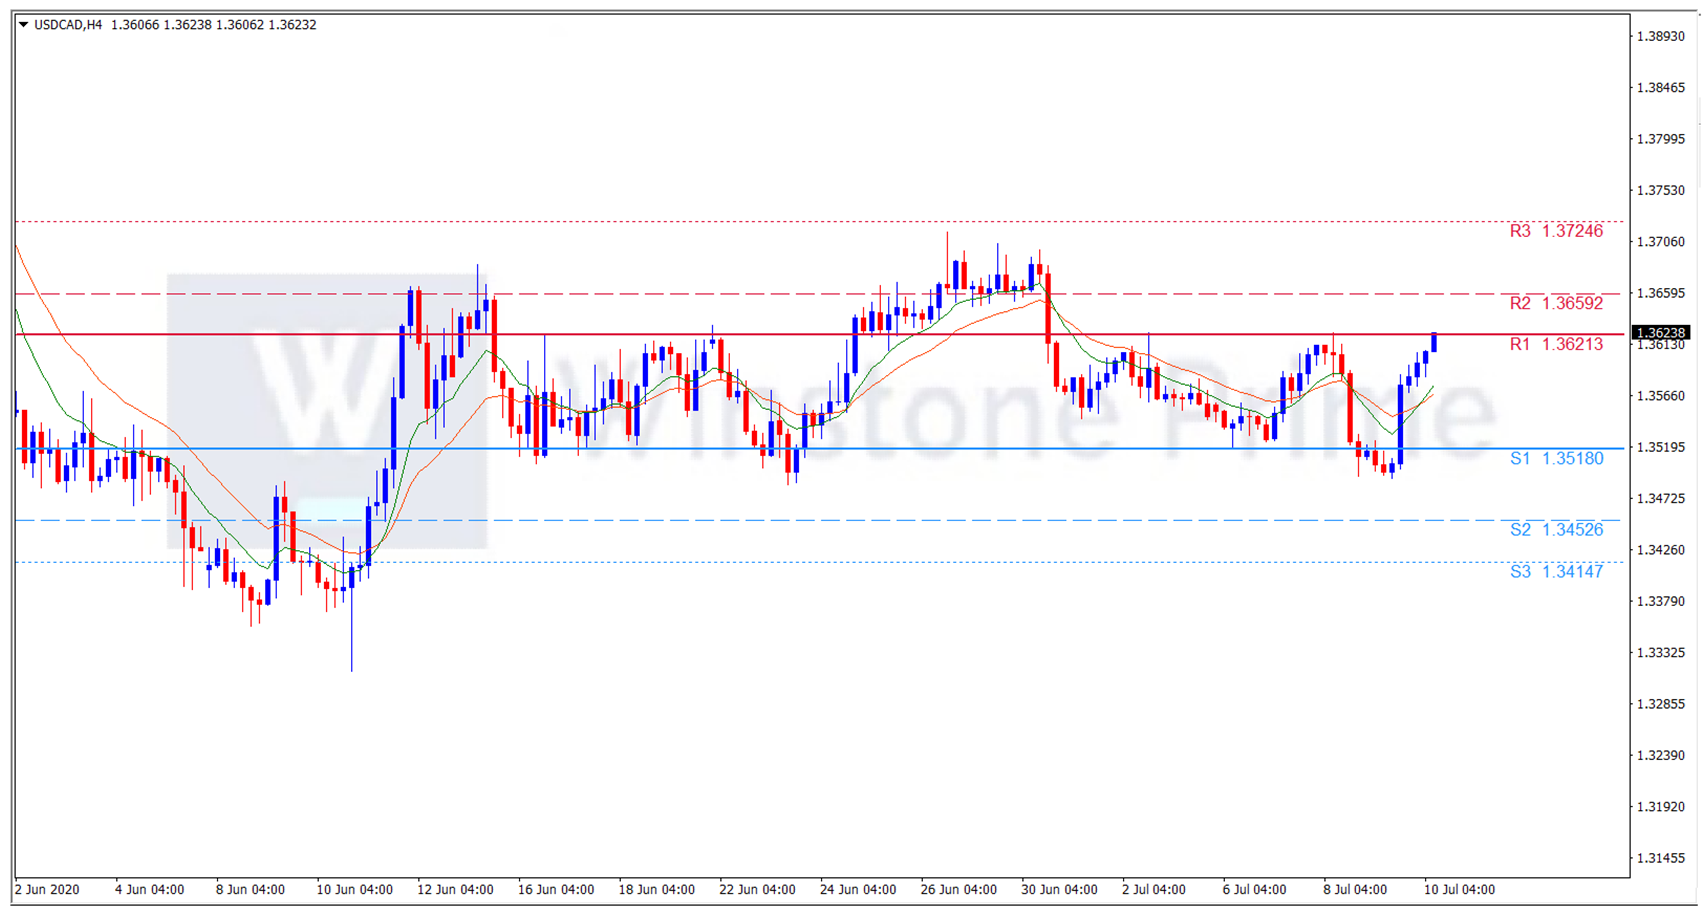 Support: 1.3518 (S1), 1.3453 (S2), 1.3415 (S3).
Resistance: 1.3621 (R1), 1.3659 (R2), 1.3725 (R3).
The prevailing market sentiment favors safe haven asset -USD and pressurizes Canadian dollar, we expect a bullish trend for USD/CAD.
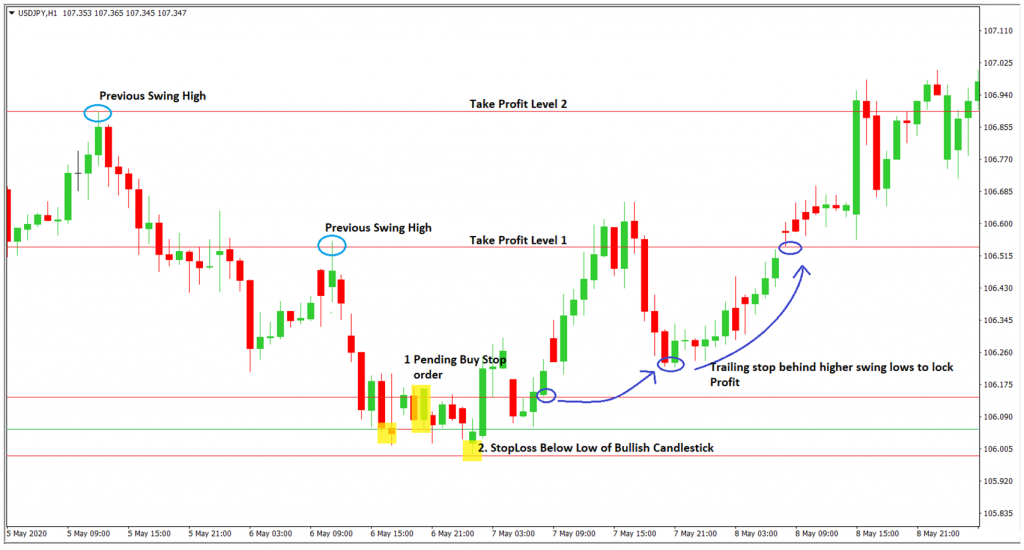
False Breakout Trading Strategy

False breakout trading strategy allows the traders to trade horizontal support and resistance levels when price makes a breakout only to fail later.
False Breakouts Happen and We need to identify them :
- At times, when the price will break a support and resistance level on chart this level in broken.
- It was just a price spike and later the resistance and support will be obeyed.
- Now, the false breakout trading strategy helps you to trade horizontal support and resistance levels when price makes a breakout only to fail later.
- Many traders get stopped out due to this breakout and walk away too early.
Timeframes : Any
Instrument : You can use this strategy for any Instruments.
We need is to know what kind of breakout chart pattern you to look for when there is a false breakout
- Now, usually when this false breakout happens, it’s a very good signal that the market will head in the other direction.
- So if we initial breakout trade stopped out, don’t walk away.
- We can trade this false breakout using a false breakout pattern.
Steps to Identify the Breakout Chart Patterns :
- Market should be in the uptrend making higher highs.
- These higher highs are in fact acting as resistance levels and you need to identify and know them because in the process of price going higher it would usually pullback and then again heading up and breaking the nearest higher high to create another new higher high.
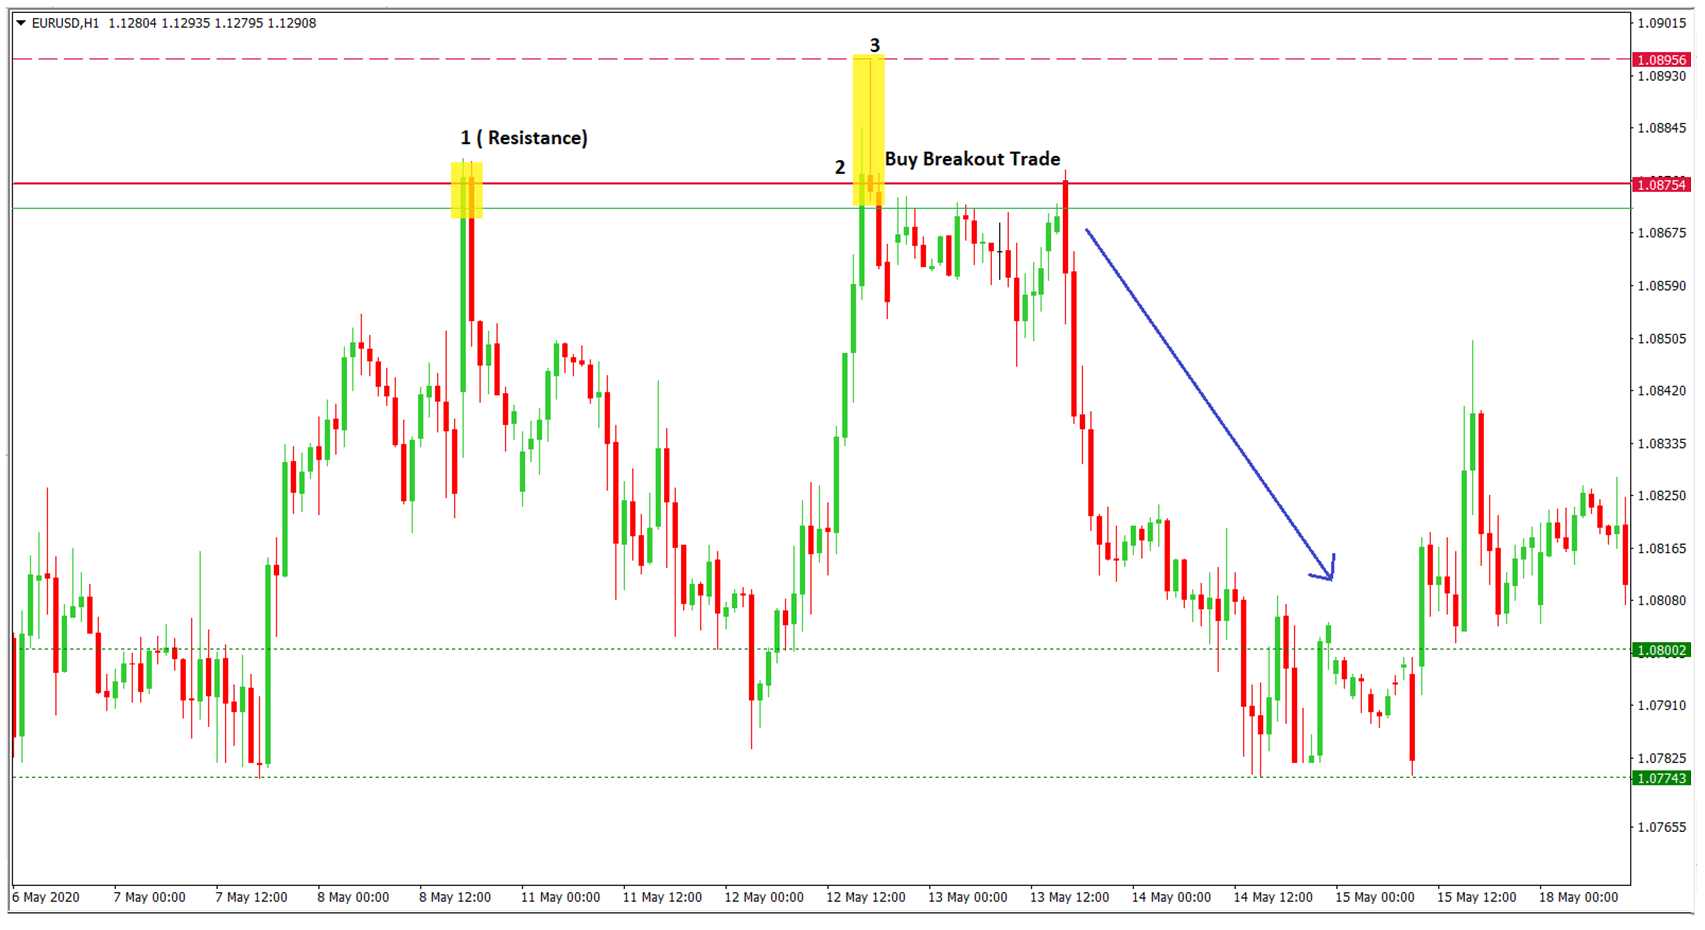
- Wait until for the breakout happens. The breakout candlestick should close above the resistance level and looking like a genuine breakout.
- But the 2nd Candlestick after the breakout should be a bearish or very bearish reversal candlestick pattern and it should ideally close near or just below the resistance level it just broke.
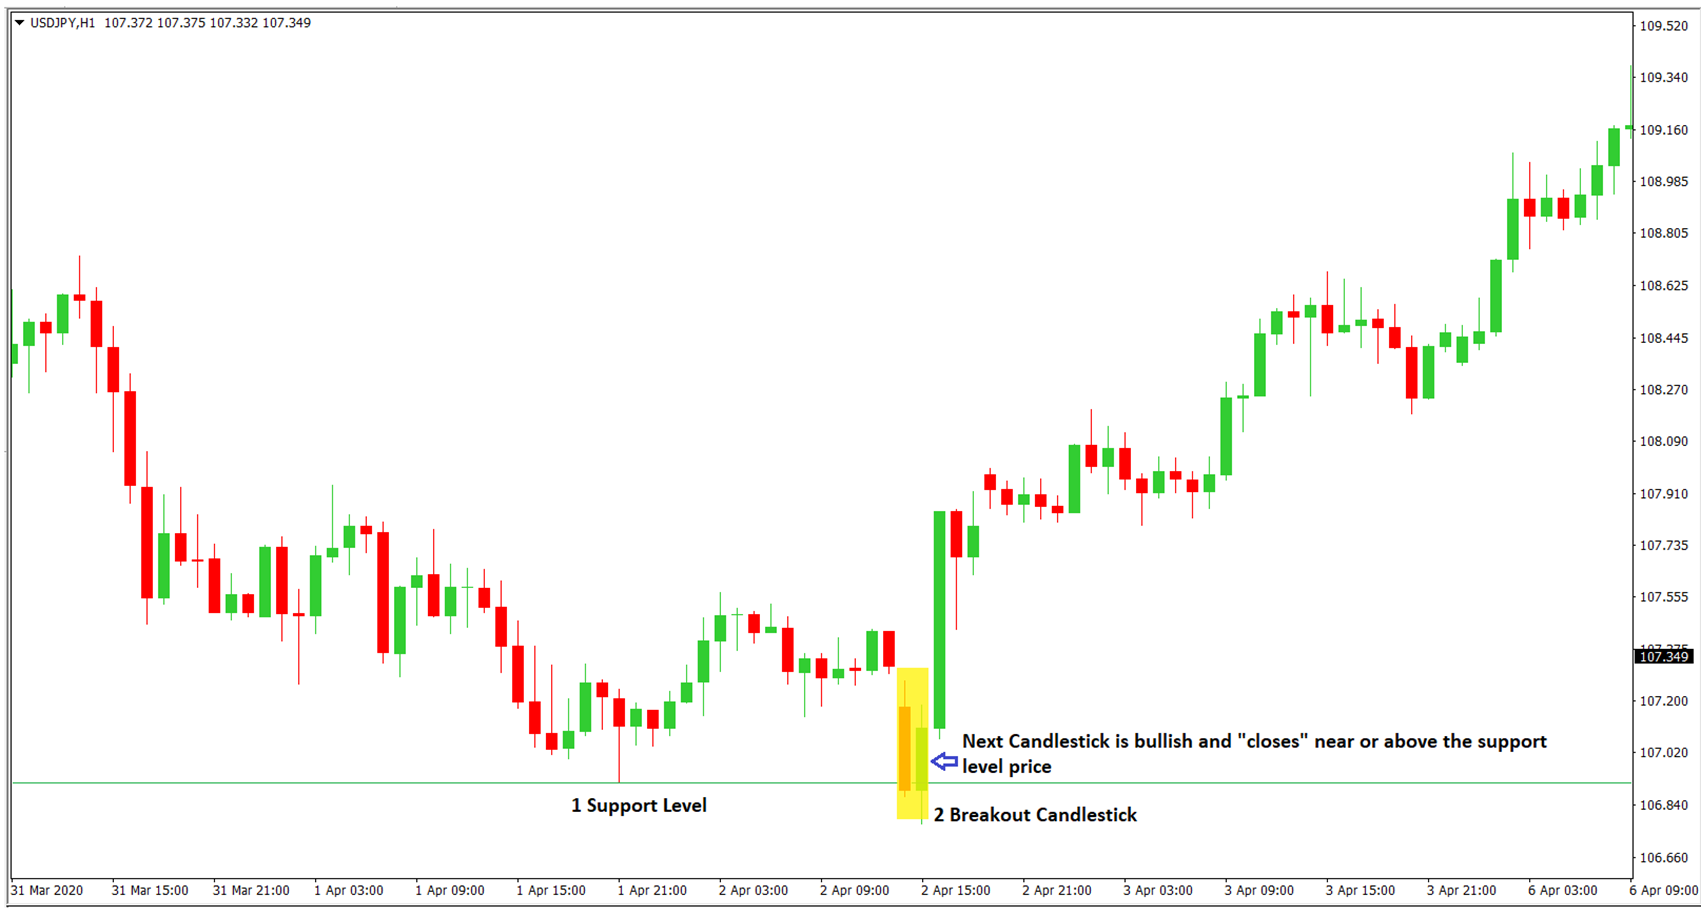
- Market should be in a downtrend making lower lows.
- These lower lows are in fact acting as support levels and you need to identify and know them because in the process of price going lower usually rally back up temporarily and then head down again breaking the nearest lower lows to create another new lower low.
- Wait until the breakout to happen. The breakout candlestick should close below the support level thus making it look like a genuine breakout.
- But the 2nd candlestick after the breakout should be a bullish or very bullish reversal candlestick pattern and it should ideally close near or just above the resistance level it just broke.
The Trading Rules for False Breakout Trade :
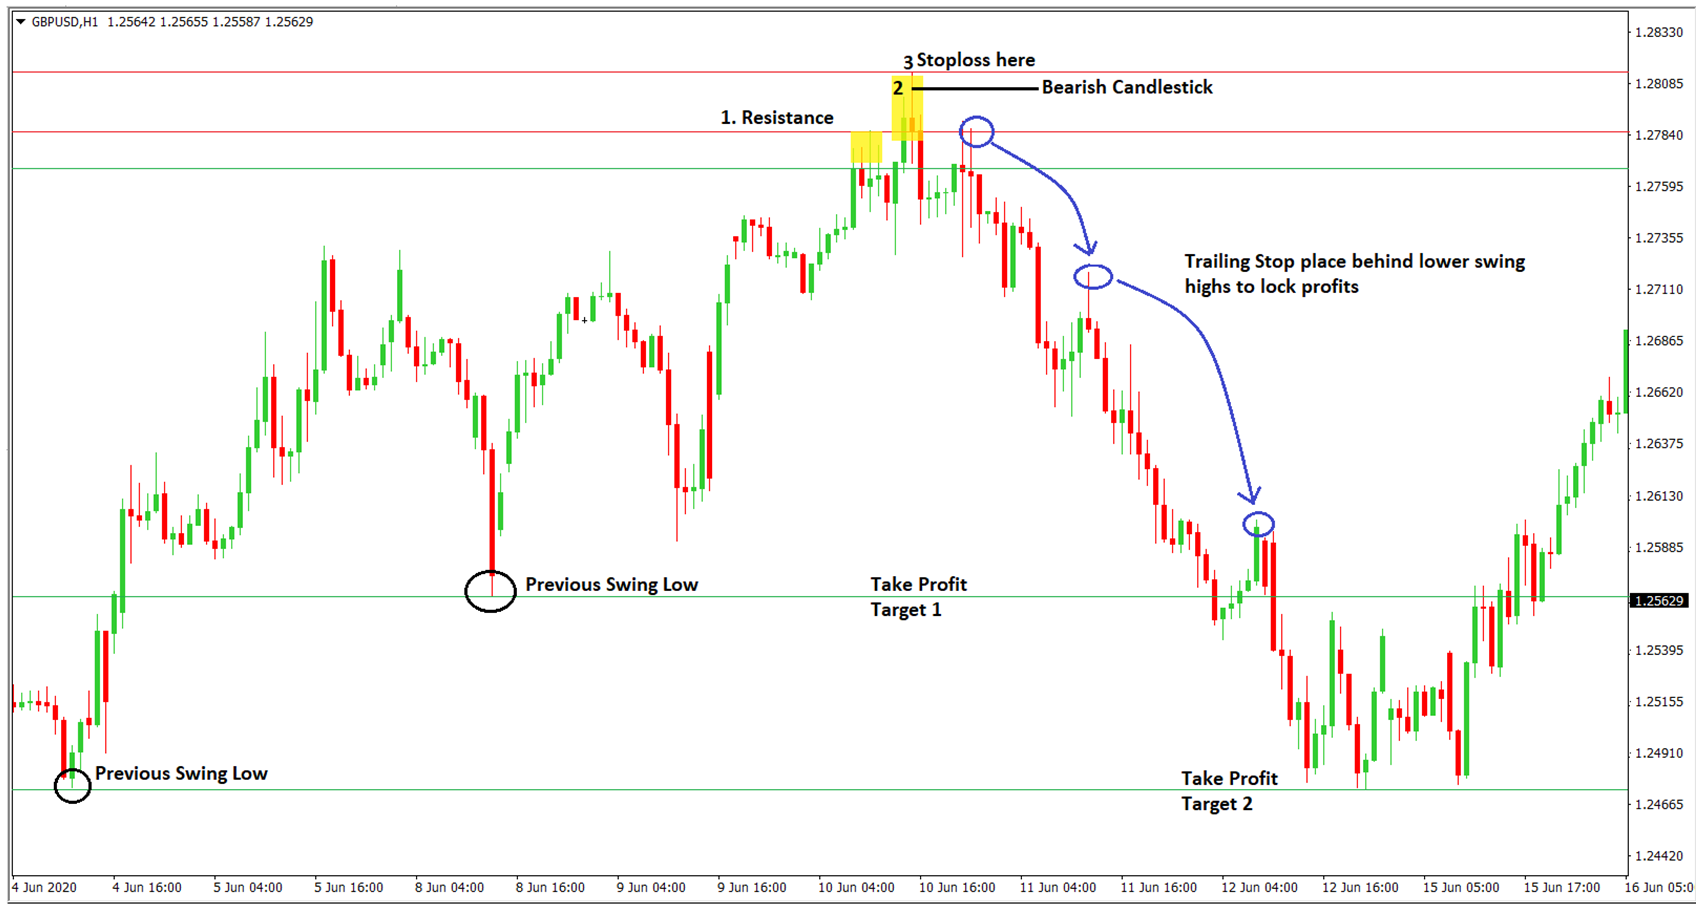
- You need to place a sell stop pending order 2-3 pips below the low of the bearish candlestick.
- Your stop loss should be 3-5 pips above the high of that bearish candlestick.
- Use Previous swing lows as your Take Profit 1, Take Profit 2 levels etc.
Trail your stop loss behind lower swing highs and lock in your profits as the trade goes profitable.
- Place a buy stop pending order 2-3 pips above the high of the bullish candlestick.
- Your stop loss should be 3-5 pips below the low of that bullish candlestick.
- Use Previous swing highs as your Take Profit 1, Take Profit 2 levels etc.
Trail stop your stop loss behind higher swing lows and lock in your profits as the trade goes profitable.
Pros :
- The False breakout chart pattern tend to go on for a very long time hence you can make a good profit when you are trading in larger time frames like the 4hr and the daily charts.
- Simple even beginners can use it.
- Good Risk Reward ratio. You can risk 40 pips for a 240 pips profit.
Cons :
- You can easily miss the false breakout trading strategy by following the other chart patterns.
- At times false breakout signal can be actually false. Which means you will suffer a loss even though the trading setup was perfect. As an example, there might be a price spike on the 3 candlestick after the breakout which can knock out your stop loss. Or there will be false breakout signal and you will get into a trade and then a few candlesticks later the real breakout happens! Such is the nature of the forex market.
Rising cases of COVID 19 pressurizes Dollar

U.S. stocks have recovered most of this year’s losses, helping to push up global prices, despite rising numbers of American corona virus infections that threaten to derail economic improvement. Investors are buying technology and other companies they expect to emerge stronger from the global downturn. Amazon added 2.7%, Apple rose 2.3% and Microsoft gained 2.2%.
COVID 19 cases in US has reached 3 million overnight, affecting more than 60k on July 8th. California, Hawaii, Idaho, Missouri, Montana, Oklahoma, and Texas broke their previous daily record highs for new infections. The country now has 3,035,231 COVID-19 cases, including 132,041 deaths. This rise in cases began at the end of May, following the reopening of most states’ local economies. Fed’s Bostic reiterated that the infections spikes are hampering the reopening outlook, but broad shut down is not expected.
Despite numbers of new cases, Dr. Fauci saying that a Phase 3 vaccine trials may begin at the end of July favored dollar. Investors picked up on his cautious optimism for a vaccine by year-end. US currency has decreased in value with response to the corona virus pandemic and protests over racial inequality that has eroded support for President Donald Trump.“If we look at the idea of American exceptionalism, that has dimmed dramatically during this crisis,” said Karl Schamotta, chief market strategist at Cambridge Global Payments. “Growth differentials are tilting against the United States, putting the dollar on the defensive.”
USD/JPY 4 Hour Chart:
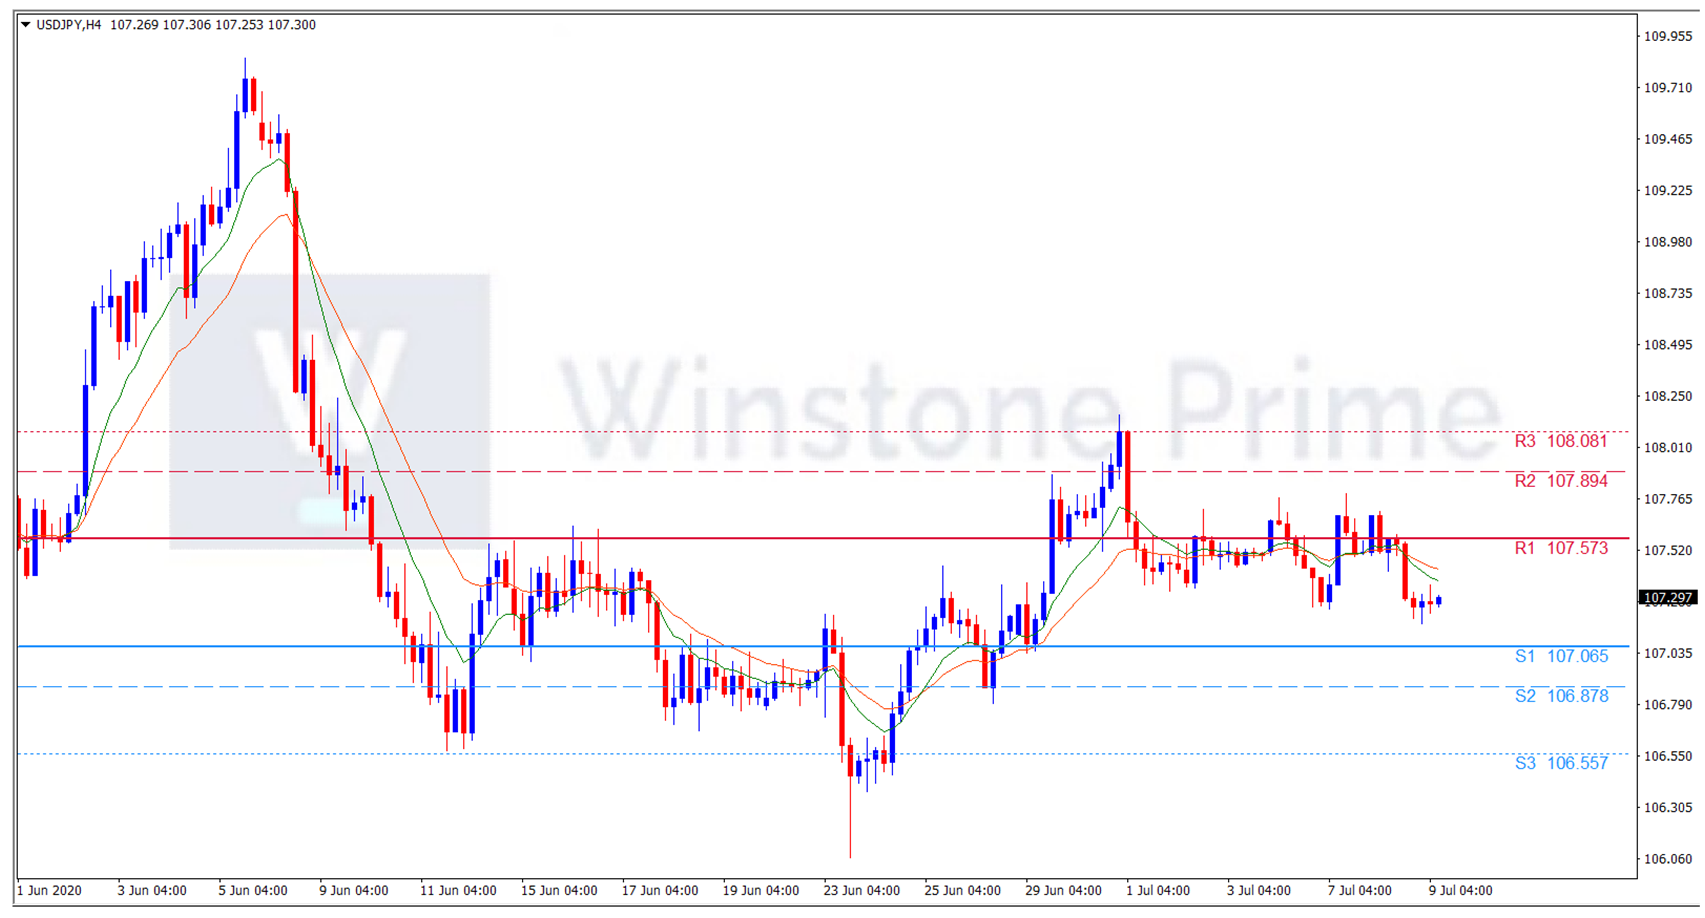 Support: 107.07 (S1), 106.88 (S2), 106.56 (S3).
Resistance: 107.57 (R1), 107.89 (R2), 108.08 (R3).
Even though the optimism among investors develops as US economy shows recovery phase and vaccine trials are underway but the rising cases of COVID 19 undermine the strength of Dollar. We expect a bearish trend for USD/JPY.