EUR/USD Weekly Forecast (6th July 2020 – 10th July 2020)

Fundamental view:

Spanish Flash Consumer Price Index (CPI) yearly report of the last week at 29th June 2020 created a bullish move for the pair where as ADP Non-Farm Employment Change at 1st July as a catalyst for the downtrend move for dollar. The fear of second wave of corona virus and the prevailing US- China has led Greenback to lose its strength which has boosted EUR against USD.

Many countries in Europe has started showing positive data in the reports of services PMI and Manufacturing  PMI last week which reflects economic recovery in the continent and created hope among the investors .Hence EUR/USD showed a bullish trend last week.

The major economic events deciding the movement of the pair in the next week are EUR Retail Sales monthly report, USD ISM Non-Manufacturing PMI at Jul 06, European Union Economic Forecasts at Jul 08, USD Unemployment Claims at Jul 09, French Industrial Production monthly report, and USD Core Producer Price Index (PPI) monthly report at Jul 10.

EUR/USD Weekly outlook:

Technical View:


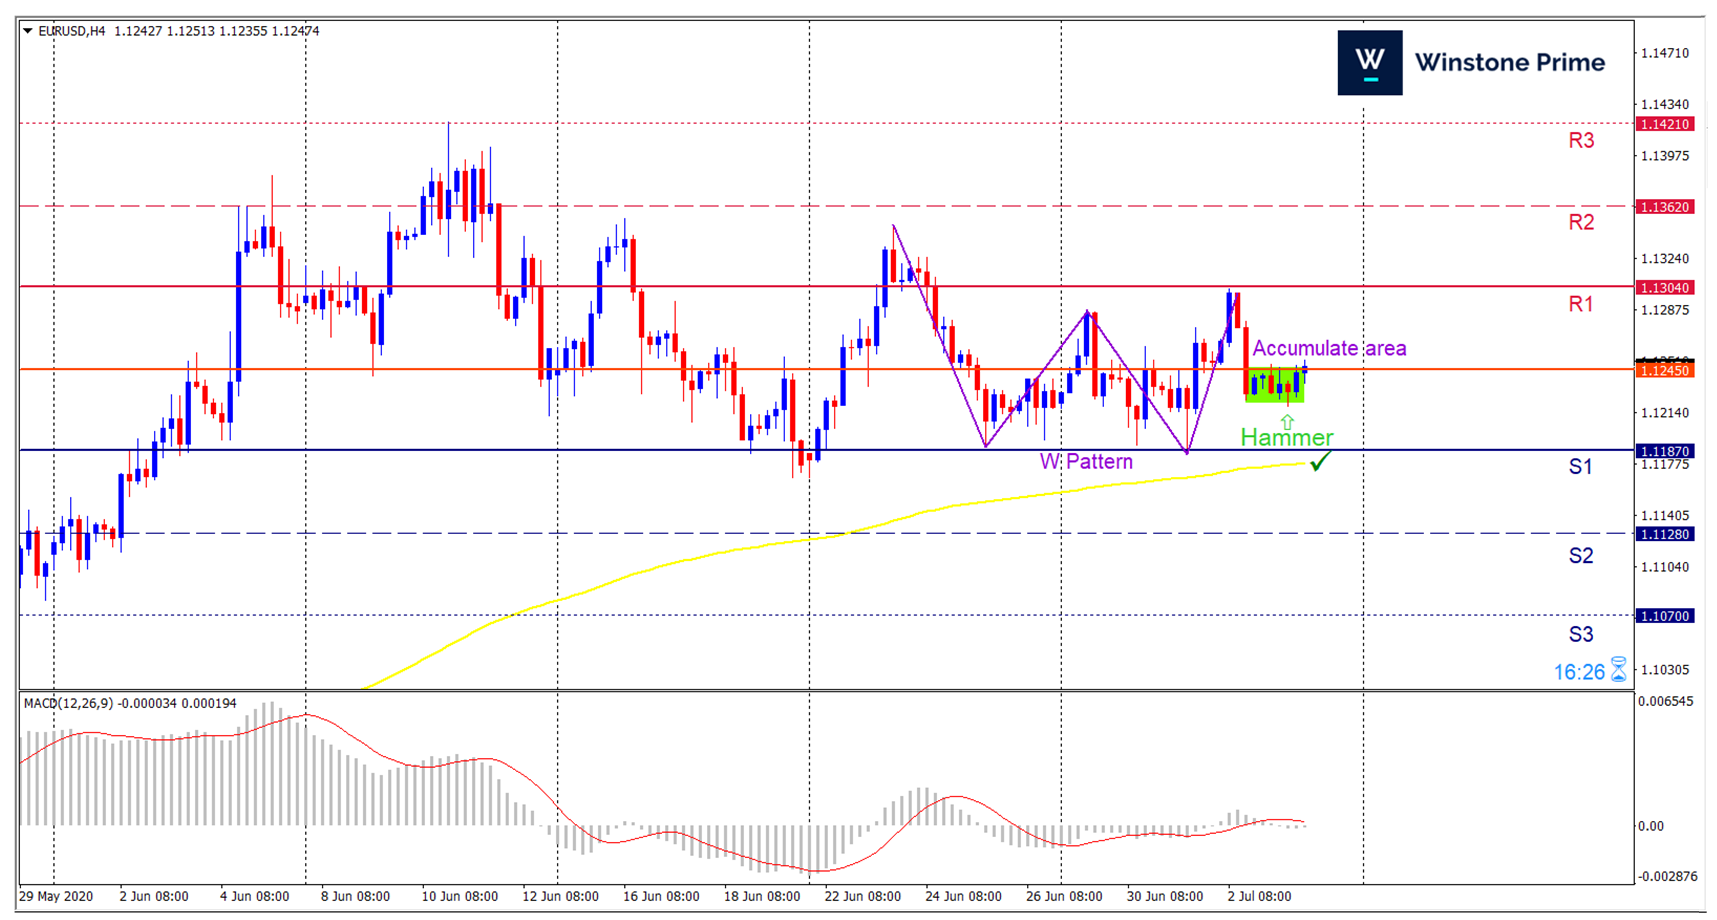
Last week’s high was 0.40% lower than the previous week. Maintaining high at 1.1302 and low at 1.1185 showed a movement of 117 pips.

In the upcoming week we expect EUR/USD to show a bullish trend. The currency pair is trading above the 200 Simple Moving Average and the MACD trades to the upside. A solid breakout above 1.1304 may open a clean path towards 1.1362 and may take a way up to 1.1421. Should 1.1187 prove to be unreliable support, the EURUSD may sink downwards 1.1128 and 1.1070 respectively. Chart formation of a Good W pattern with accumulated area in H4 chart sets prospects for a bullish trend. Bearish Hammer formation in H4 chart escalates the expectation for a bullish trend.

Preference
Buy: 1.1190 target at 1.1383 and stop loss at 1.1087


Alternate Scenario
Sell:  1.1087 target at 1.0944 and stop loss at 1.1190

GBP/USD Weekly Forecast (6th July 2020 – 10th July 2020)

Fundamental view:

BOE Gov Bailey Speaks creates on 29th created some optimism for sterling whereas Favourable pending sales report for US on 29th June 2020 created a bearish move for the pair. ADP Non-Farm Employment Change at 1st July acted catalyst for the downtrend move for dollar and boosted bullish move for the pair. Increasing cases of covid 19 cases in US sets fear on second wave of corona virus which has unfavourable effect on the safe haven asset – USD.

MPC Member Haskel and BOE Gov Bailey optimistic speech last week created confidence among the investors which created a bullish trend for the pair in previous week.

The major economic events deciding the movement of the pair in the next week are GBP Construction PMI, USD ISM Non-Manufacturing PMI at Jul 06, GBP Halifax House Price Index (HPI) monthly report at Jul 07, USD Unemployment Claims at Jul 09, and USD Core Producer Price Index (PPI) monthly report at Jul 10.

GBP/USD Weekly outlook:

Technical View:


Last week’s high was 0.09% lower than the previous week. Maintaining high at 1.2530 and low at 1.2251 showed a movement of 279 pips.

In the upcoming week we expect GBP/USD to show a bullish trend.  The currency pair is trading above the 100 Simple Moving Average and the MACD trades to the upside. A solid breakout above 1.2592 may open a clean path towards 1.2700 and may take a way up to 1.2871. Should 1.2313 prove to be unreliable support, the GBPUSD may sink downwards 1.2142 and 1.2034 respectively. Chart formation of a Cup and saucer formation in H4 chart favors prospects of a bullish trend. Bullish spinning tool formation escalates the expectation for the bullish trend.

Preference
Buy: 1.2410 target at 1.2663 and stop loss at 1.2260


Alternate Scenario
Sell:  1.2260 target at 1.2073 and stop loss at 1.2410

AUD/USD Weekly Forecast (6th July 2020 – 10th July 2020)

Fundamental view:

RBA Deputy Gov Debelle Speaks of the last week at 30th June 2020 created a bullish move for the pair whereas Non-Farm Employment Change at 1st  July as a catalyst for the downtrend move for dollar and boosted bullish move for the pair. Improvement in the cases of corona virus and steps taken by the country for economic recovery creates optimism for Aussie among investors.

Retail sales positive report and optimistic speech of RBA Deputy Gov Debelle last week created a favorable atmosphere for AUD hence AUD/USD showed a bullish trend last week.

The major economic events deciding the movement of the pair in the next week are AUD MI Inflation Gauge monthly report, USD ISM Non-Manufacturing PMI at Jul 06, AUD RBA Rate Statement at Jul 07, AUD Home Loans report, USD Unemployment Claims at Jul 09, and USD Core Producer Price Index (PPI) monthly report at Jul 10.

AUD/USD Weekly outlook:

Technical View:

Last week’s high was 0.32 % lower than the previous week. Maintaining high at 0.6951 and low at 0.6832 showed a movement of 119 pips.

In the upcoming week we expect AUD/USD to show a bullish trend.  The currency pair is trading above the 100 Simple Moving Average and the MACD trades to the upside. A solid breakout above 0.6982 may open a clean path towards 0.7026 and may take a way up to 0.7101. Should 0.6863 prove to be unreliable support, the AUDUSD may sink downwards 0.6788 and 0.6744 respectively. In H4 chart, formation of an Ascending triangle chart favors prospects of a bullish trend. Also to be noted Bullish Hammer formation exerts the expectation of uptrend for the pair.


Preference
Buy: 0.6916 target at 0.7019 and stop loss at 0.6833


Alternate Scenario
Sell:  0.6833 target at 0.6638 and stop loss at 0.6916

BTC/USD Weekly Forecast (6th July 2020 – 10th July 2020)

Fundamental view:

Fed Chair Powell Testifies of the last week at 30th June 2020, Unemployment rate and President Trump Speaks at 2nd July 2020 acted as a catalyst for the uptrend move for dollar and boosted bearish move for the pair in the last week.

The major economic events deciding the movement of the pair in the next week are ISM Non-Manufacturing PMI at Jul 06, IBD/TIPP Economic Optimism at Jul 07, Consumer Credit monthly report at Jul 08, Unemployment Claims at Jul 09, and Core Producer Price Index (PPI) monthly report at Jul 10 for US.

BTC/USD Weekly outlook:

Technical View:

Last week’s high was 4.9% higher than the previous week. Maintaining high at 9282.6 and low at 8927.9 showed a movement of 354 pips.

In the upcoming week we expect BTC/USD to show a bearish trend.  A solid breakout below 8906.9 may open a clean path towards 8740.1 and may take a way down to 8552.2. Should 9261.6 prove to be unreliable resistance, the USDJPY may raise upwards 9449.5 and 9616.3 respectively. In H4 chart, formation of bearish wedge and 3 black crows constructs a bearish outlook for the pair in the upcoming week.

Preference
Sell:  9055.8 target at 8735.4 and stop loss at 9285.4


Alternate Scenario
Buy:  9285.4 target at 9606.1 and stop loss at 9055.8