XAU/USD Weekly Forecast (6th July 2020 – 10th July 2020)

Fundamental view:

Non-Farm Employment Change at 1st  July as a catalyst for the downtrend move for dollar and FOMC Member Williams Speaks of the last week at 30th June 2020 created a favorable atmosphere for USD and a bearish trend was reflected for the pair in the previous week.

Investor’s remain hopeful on the economic recovery as economies will reopen from lockdowns might have given dollar a firm position against USD hence investors showed interest in dollar instead of the safe haven asset – Gold.

The major economic events deciding the movement of the pair in the next week are ISM Non-Manufacturing PMI at Jul 06, IBD/TIPP Economic Optimism at Jul 07, Consumer Credit monthly report at Jul 08, Unemployment Claims at Jul 09, and Core Producer Price Index (PPI) monthly report at Jul 10 for US.

XAU/USD Weekly outlook:

Technical View:

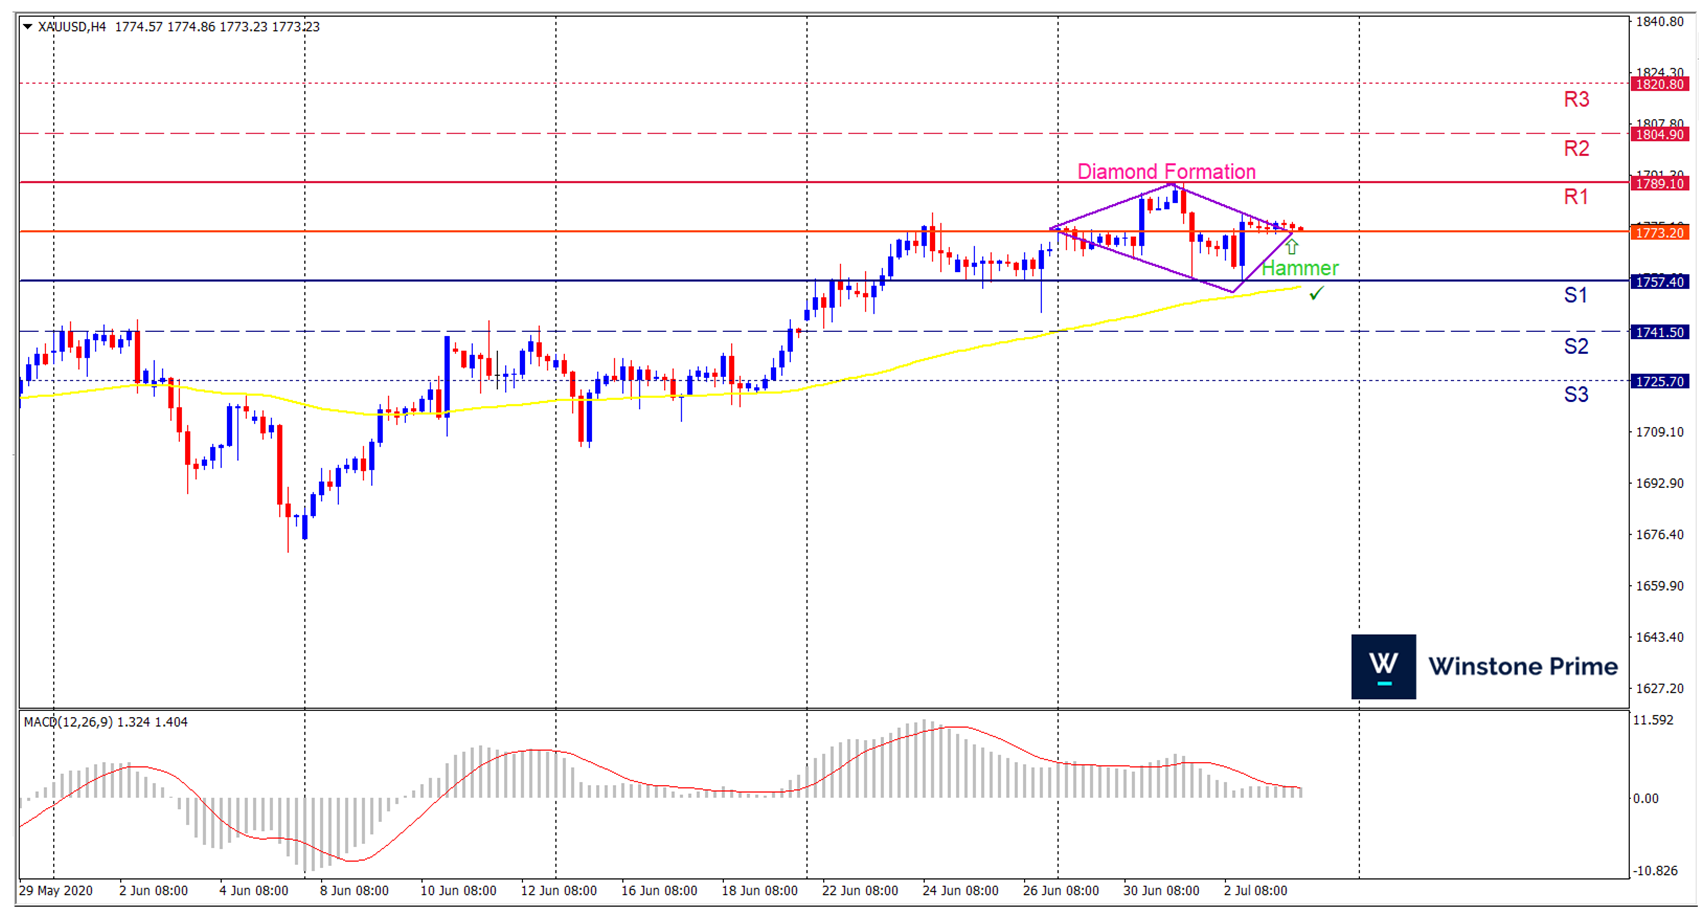
Last week’s high was 0.55% higher than the previous week. Maintaining high at 1789.1 and low at 1757.4 showed a movement of 317 pips.

In the upcoming week we expect XAU/USD to show a bullish trend.  The currency pair is trading above the 100 Simple Moving Average and the MACD trades to the upside. A solid breakout above 1789.1 may open a clean path towards 1804.9 and may take a way up to 1820.8. Should 1757.4 prove to be unreliable support, the XAUUSD may sink downwards 1741.5 and 1725.7 respectively. In H4 chart breakout of a Diamond to the upside and formation favors prospects of a bullish trend. Also to be noted Bullish Hammer formation exerts the expectation of uptrend for the pair.

Preference
Buy: 1779.4 target at 1801.7 and stop loss at 1759.1


Alternate Scenario
Sell:  1759.1 target at 1731.8 and stop loss at 1779.4

USD/JPY Weekly Forecast (6th July 2020 – 10th July 2020)

Fundamental view:

Consumer Confidence of US at 1st July 2020 created a bearish move for the pair whereas Unemployment rate and President Trump Speaks at 2nd July 2020 acted as a catalyst for the uptrend move for dollar and boosted bullish move for the pair. Japan’s manufacturing PMI report is favourable for yen but the rising cases of covid 19 cases do not create confidence among investors.

Reports like Tankan Manufacturing Index and Housing starts yearly report portrayed the struggling face of Japan thus last week USD/JPY reflected a bullish trend.

The major economic events deciding the movement of the pair in the next week are USD ISM Non-Manufacturing PMI at Jul 06, JPY Bank Lending yearly report at Jul 07, JPY Economy Watchers Sentiment at Jul 08, JPY Prelim Machine Tool Orders yearly report, USD Unemployment Claims at Jul 09, and USD Core Producer Price Index (PPI) monthly report at Jul 10.

USD/JPY Weekly outlook:

Technical View: 

Last week’s high was 0.67% higher than the previous week. Maintaining high at 108.16 and low at 107.04 showed a movement of 112 pips.

In the upcoming week we expect USD/JPY to show a bearish trend. The currency pair is trading below the 200 Simple Moving Average and the MACD trades to the Downside. A solid breakout below 106.97 may open a clean path towards 106.45 and may take a way down to 105.85. Should 108.03 prove to be unreliable resistance, the USDJPY may raise upwards 108.69 and 109.21 respectively. In H4 chart, Formation of rising wedge pattern indicates reversal of the trend creating prospects of a bearish trend Along with a bearish spinning top formation braces our expectation.

Preference
Sell: 107.81 target at 106.83 and stop loss at 108.35


Alternate Scenario
Buy:  108.35 target at 109.17 and stop loss at 107.50

Retail Sales Report Encourages Aussie

As per the Retail Sales monthly report, The seasonally adjusted estimate rose 16.9% in May 2020. This is followed a fall of 17.7% in April, and a rise of 8.5% in March 2020.

The following industries rose in seasonally adjusted terms in May 2020: Clothing, footwear and personal accessory retailing (129.2%), Food retailing (7.2%), Household goods retailing (16.6%), Cafes, restaurants and takeaway food services (30.3%), Department stores (44.4%), and Other retailing (9.4%).

New South Wales, Victoria, Queensland, New South Wales, Western Australia, South Australia  Tasmania, Australian Capital Territory and the Northern Territory shows seasonally adjusted terms in May 2020.

Ben James, Director of Quarterly Economy Wide Surveys said that The gradual easing of social distancing regulations, and the re-opening of physical stores, bolstered retail trade in May.

Main hotpot of the COVID-19 in Australia state of Victoria reported 66 new infections on Friday, down from Thursday’s rise by 77. Off the 66, 17 from known outbreaks, 1 hotel quarantine, 20 from routine testings, and 28 under investigation. There are 442 active cases of COVID-19 in Victoria, which are outside the marked hotspot areas.

Believing COVID – 19 as a conspiracy, Ten thousand refuse tests in Victoria. Meanwhile, New South Wales (NSW) registers no new cases and Queensland is set to ease restrictions.

 AUD/USD 4 Hour Chart:

Support: 0.6901 (S1), 0.6876 (S2), 0.6851 (S3).

Resistance: 0.6951 (R1), 0.6976 (R2), 0.7001 (R3).

All these catalysts favoring Aussie and Bank holiday in US attracts investors to buy AUD. We expect a Bullish trend for AUD/USD.

Diagonal Breakout Bounce Trading Strategy

A price channel pattern in simple terms is when the price is running between (in a channel) support and resistance levels. When price is in a channel, it tends to stay in that channel until a channel breakout happens.

Now, there are two main kinds of price channels :

  • The horizontal channel.
  • The diagonal price channel.


This trading strategy is based on the diagonal channel pattern.

One of the most common types of strategies used by traders is breakout types of strategies. It might be due to the volatility and price movements in one direction as price breaks out of a trend line.

The traders commonly look are breakouts from horizontal supports and resistances. But breakouts from diagonal supports and resistances are also very profitable. This is because these types of breakouts are often reversal breakouts, which allows you to catch a move close to where it started.

One thing about breakouts from diagonal supports and resistances, these supports and resistances are often part of a structure. These could vary from channels, to price patterns like the wedges or triangles. And as part of structures, we often know that sooner or later, these structures will end and breakout.

The 200-EMA moves fairly slow and doesn’t hug price too much as compared with 20- EMA’s and 50 EMA’s, allowing price structures to form near it, without letting price whipsaw it. This allows us as traders to make more sense of what price wants to do.  As price gets near or touches the 200-EMA, we would already have an idea that price might bounce off the 200-EMA and start to breakout of the channel. We might see a triangle pattern forming near the 200-EMA, but it doesn’t whipsaw our moving average. Then we have an idea which way the triangle pattern is more likely to breakout to.

Let’s start on how to trade with this strategy.

Timeframes :  Any

 Instrument :  You can use this strategy for any Instruments.

 Indicators :  Diagonal breakout bounce

Long Entry :

  • Trendlines should be plotted forming the price structure – Channel
  • Identify the location of price in relation to the 200-EMA
  • Anticipate a breakout from resistance as soon as the price starts touching the 200-EMA if price is above the 200-EMA.
  • As soon as price breaks out and closes above the resistance, enter the trade with a market order


Stop Loss : Set Stop loss at few pips below the entry candle.

Exit : Trail the stop loss on fractals until stopped out on profit.

Short Entry :

  • Trendlines should be plotted forming the price structure – Triangle
  • Identify the location of price in relation to the 200-EMA
  • Anticipate a breakout from support as soon as the price starts touching the 200-EMA if price is below the 200-EMA.
  • As soon as price breaks out and closes below the support, enter the trade with a market order


Stop Loss : Set Stop loss at few pips above the entry candle.

Exit : Trail the stop loss on fractals until stopped out on profit.

Pros :

  • Great tool even for price action and breakout traders.
  • It not only gives us an idea with regards to the direction of price, but it also helps traders make sense of the chart.


Cons :

  • It might bore some traders, since trades using this strategy don’t come too often. This is because some smaller structures breakout to the direction indicated by the 200-EMA even without touching it.
  • The price often doesn’t get to come near it.
  • In some cases, the trend has already weakened too much that when it crosses the 200-EMA, it actually is a long-term reversal of a trend.