MACD Crossover Strategy

MACD is an acronym for Moving Average Convergence Divergence. This indicator is a tool that’s used to identify moving averages that are indicating a new trend, whether it’s bullish or bearish. After all, our top priority in trading is being able to find a trend, because that is where the most        

This trading strategy works as :

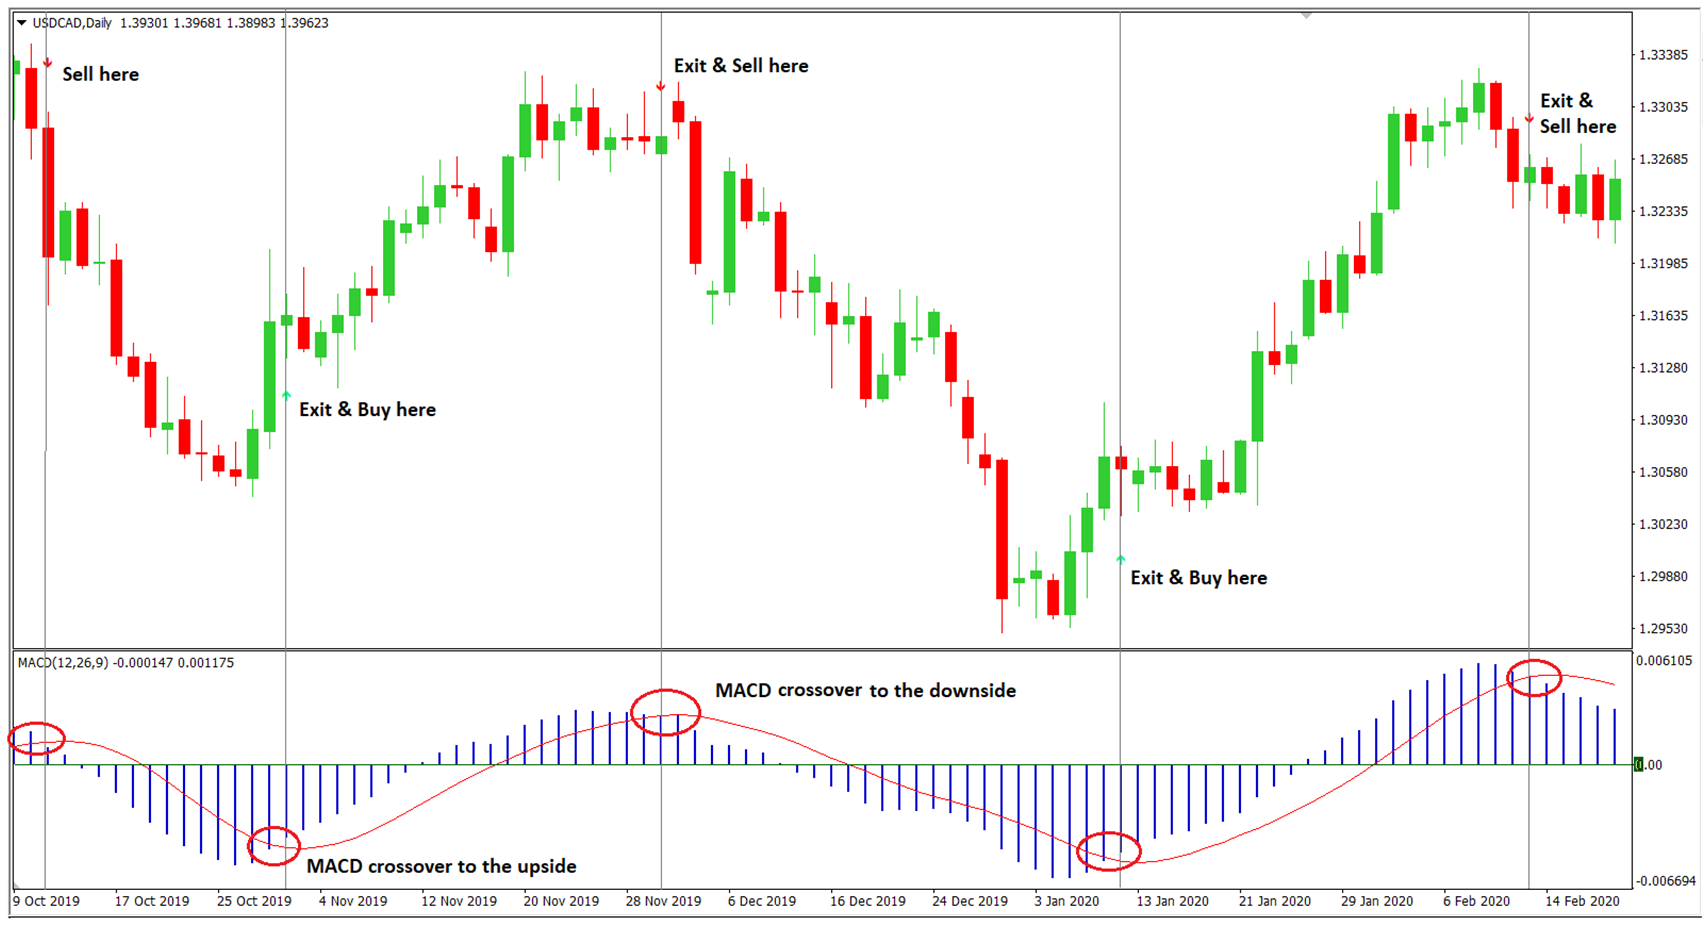
  • The MACD is one of the most popular indicators which are used by traders to determine the trend.
  • The MACD consists of two lines, the faster moving and the slower moving line.
  • It’s an uptrend when the faster moving line crosses the slower moving line to the upside, so you can go for a long position.
  • It’s a downtrend when the faster moving line crosses slower moving line to the downside, so you can go for a short position.


Timeframes :  Any

Instrument :You can use this strategy for any Instruments.

Indicators :  MACD

Trading Rules :

  • Crossing of MACD is must.           
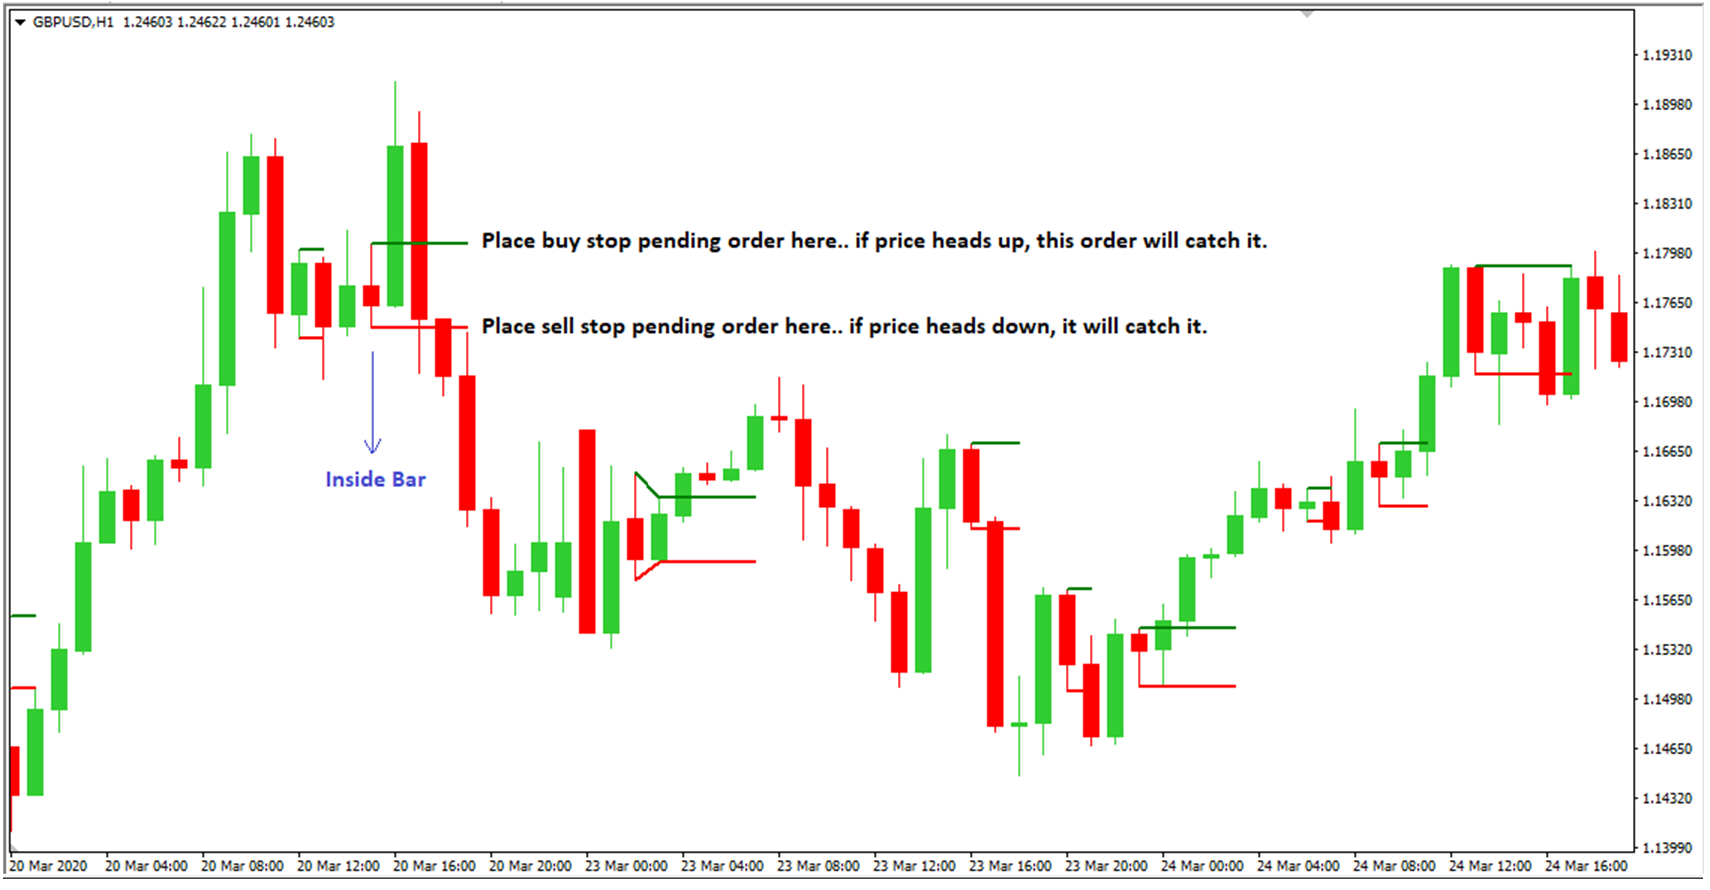
  • Depending on the trend place a buy stop or sell stop order.
  • Place stop loss away from your trade entry point to avoid getting prematurely stopped out.
  • Wait for the opposite signal to exit the trade. For example, if you were in a sell trade, then wait for a buy signal and when that happens, you exit your sell trade and enter a buy trade.


Pros :

  • Great in a trending market where you can make huge profits.
  •  Easy for beginners to use.


Cons :

  • It is lagging strategy, The signals can be late, it means the market has already made a big move and you stopped out.
  • False signals will appear during range markets.

Inside Bar Trading Strategy

An “inside bar” pattern is a two-bar price action trading strategy in which the inside bar is smaller and within the high to low range of the prior bar, i.e. the high is lower than the previous bar’s high, and the low is higher than the previous bar’s low.

  • the inside bar is a 2-candlestick formation.
  • the first candlestick that forms called the “mother candlestick”
  • the second candlestick that forms after the “mother candlestick” is engulfed completely within the shadows of the mother candlestick. That second candlestick is called the “inside bar”.


Instrument : You can use this strategy for any currency pairs.

Timeframes : Preferable for 4hr and the daily timeframes

Below we given example of how inside bar candlestick formation looks like :

Based on the chat above :

  • Two-candlestick formation
  • The inside bar is completely engulfed within the shadows of the preceding bar or Mother candlestick
  • The preceding candlestick can be either a bullish bar or bearish bar.
  • The inside bar itself can also be bullish or bearish candlestick.


Formation of Inside bars

Inside bars when formed show a time period of market consolidation. This market consolidation can be due to the following reasons

  • A time of indecision as traders are figuring out whether they are going to buy or sell or not as it can be a time where the bulls and bears of market forces are also almost of equal strength and each don’t know what direction to take on their trades.
  • Low trading volume


These are some of the reasons why inside bars form.

Location of Inside bars

Well, inside bars can form anywhere. Many traders take notice of inside bars forming on the level listed below:

  • Fibonacci levels
  • trend line touch areas
  • support
  • pivots
  • resistance


Its best to only pay attention to inside bars that form in the price levels listed above.

Short Entry :

Here are the selling rules :

  • The market must be in a downtrend.
  • Place a sell stop order anywhere from 2-3 pips below the low of the inside bar if you see an inside bar formation.
  • Place a stop loss anywhere from 5-10 pips above the high of the inside bar.
  • Make a exit on the close of the third candlestick also include inside bar while counting.


Long Entry :

The buying rules for the inside bar trading strategy are exactly opposite of the selling rules.

  • The market must be in an uptrend.
  • Place a buy stop order anywhere from 2-3 pips above the high of the inside bar if you see an inside bar formation.
  • Place stop loss anywhere from 5-10 pips below the low of the inside bar.
  • Make a exit on the close of the third candlestick also include inside bar while counting.


Other way to trade the the inside bar :

There’s an alternate way to trade the inside bar. You can use it if you really don’t care if price is going to go up or down. It’s a non-directional trading system.

You have to place a pending buy stop and sell stop order on both sides of the inside bar, so if price goes up or down, one of this pending order is sure to get filled/activated.

Follow the below steps :

  • If you see an inside bar formation, then you place a pending buy stop order above the high of that inside bar and also place a stop loss below the low of that inside bar. You also need to place a sell stop pending order on the low of the inside bar and place its stop loss above the high of that inside bar.
  • If one pending order is activated, then immediately cancel the other which has not been activated.
  • For exit and take profits, you can use the techniques given above.

Pros :

  • You can make high profit if the trend is strong
  • Pure price action trading
  • Time effective. If you trade using the daily chart, you need only a few minutes each day to check your chart, place your pending order when you find an Inside bar. Check later during the day to see which pending order was activated then cancel the other that was not activated.
  • Easy to follow.


Cons :

  • Too many false signals in smaller time frames.
  • Price reversal due to false breakouts can lead to loss.

BoC meeting impacts Loonie

On Wednesday’s Bank of Canada policy meeting was a much-excepted event. The interest rates of BoC was unchanged at 0.25%. The statement noted the uncertainty on how the recovery would unfold from the corona virus impacted economy but positive notes were added that the impact of COVID-19 on the economy had peaked.

There will be a further decline in the level of real GDP (Gross Domestic Product) in the second quarter for 10-20 percent as continued shutdowns and lower investment in the energy sector made an impact on output. The Boc meeting was lead by Governer Mr.Stephen Poloz’s  and His replacement, Tiff Macklem also attended the meeting but according to the BoC statement “He participated as an observer in Governing Council’s deliberations for this policy interest rate decision and endorses the rate decision and measures announced in this press release.”

In Canada, the pandemic has led to historic losses in output and jobs. Still, the 2.66 million increase in job losses was well below the forecast of a loss of 9.0 million jobs. The Canadian economy appears to have avoided the most severe scenario presented in the Bank’s April Monetary Policy Report (MPR). Decisive and targeted fiscal actions, combined with lower interest rates, are buffering the impact of the shutdown on disposable income and helping to lay the foundation for economic recovery. While the outlook for the second half of 2020 and beyond remains heavily clouded, the Bank expects the economy to resume growth in the third quarter.

CPI inflation has decreased to near zero, as anticipated in the April MPR, mainly due to lower prices for gasoline. The Bank expects temporary factors to keep CPI inflation below the target band in the near term. The Bank’s core measures of inflation have drifted down, although by much less than the CPI, and are now between 1.6 and 2 percent.

According to the statement “ As market function improves and containment restrictions ease, the Bank’s focus will shift to supporting the resumption of growth in output and employment. It will maintain its commitment to continue large-scale asset purchases until the economic recovery is well underway. Any further policy actions would be calibrated to provide the necessary degree of monetary policy accommodation required to achieve the inflation target.”

USD/CAD 4 Hours Chart:

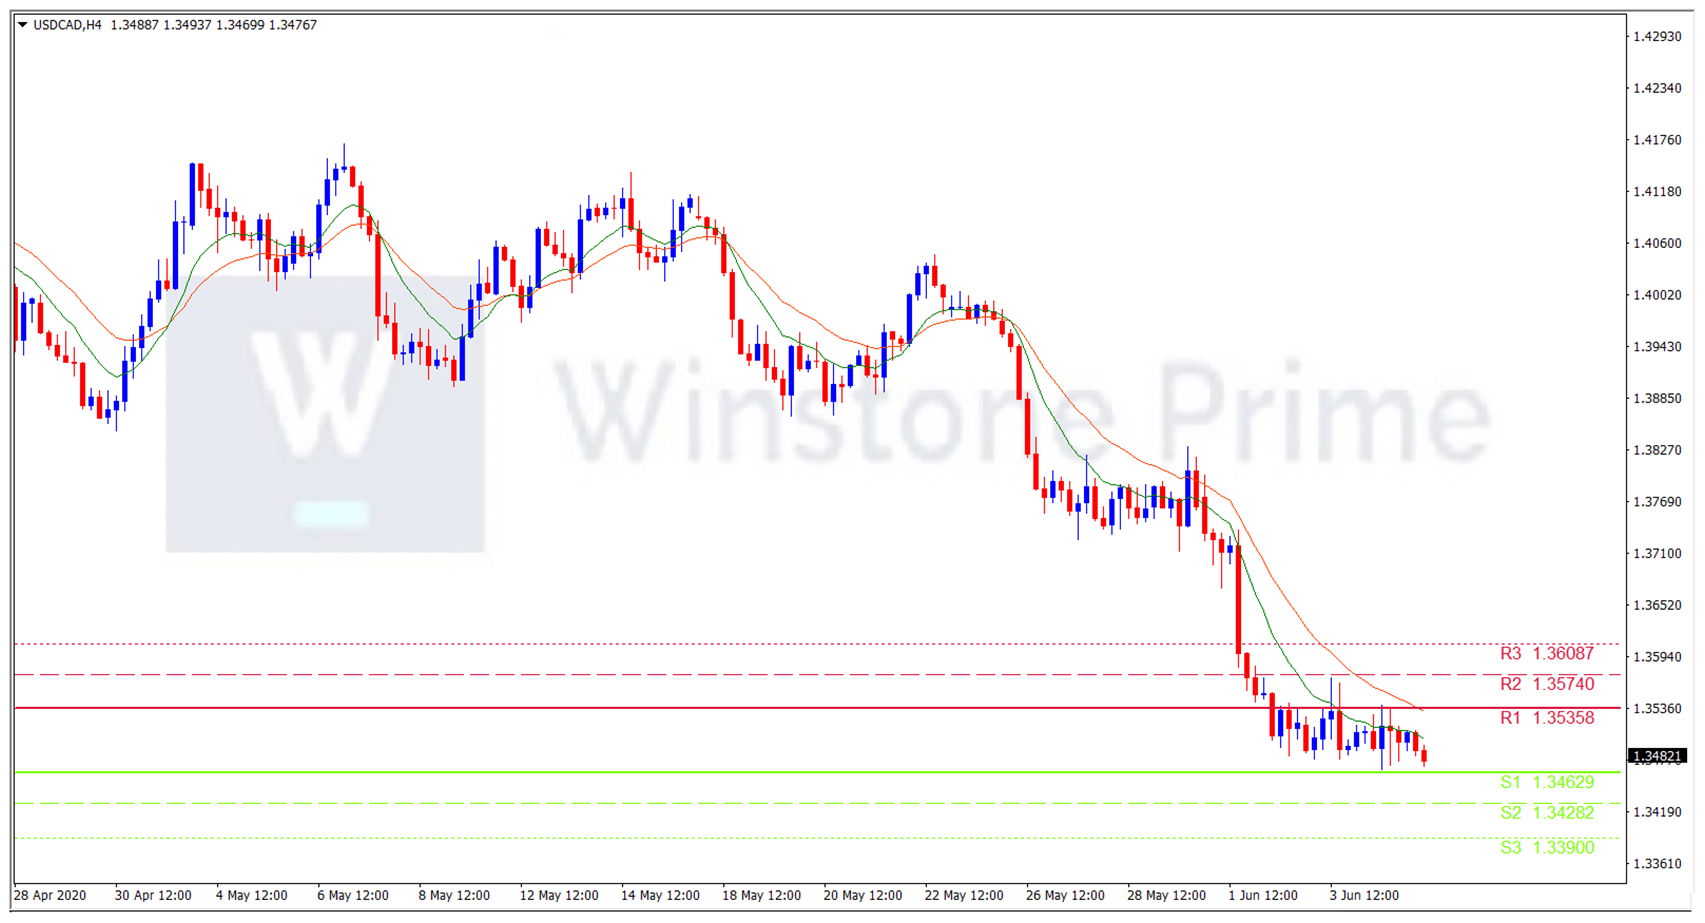
Support: 1.3463 (S1), 1.3428 (S2), 1.3390 (S3).

Resistance:  1.3536 (R1), 1.3574 (R2), 1.3609 (R3).

BoC statement shows its efforts towards the economic recovery which appeals to the investors. We expect a bearish trend for USD/CAD.

Greenback losing its appeal as a safe haven asset creates a positive trend for kiwi

Director-General of Health Dr. Ashley Bloomfield said on Thursday that for the 13th day in a row New Zealand has no new corona virus cases.

On Tuesday Prime Minister Jacinda Ardern of New Zealand said that the nation’s alert level could be reduced to 1 on June 10, meaning rules around physical distancing and mass gatherings will be removed, though strict border controls will remain in place to prevent any new infections arriving from overseas. Cabinet will make its decision on June 8. regarding the same. “Our strategy of going hard and early has paid off, in some cases beyond expectation,” Ardern told a news conference in Wellington. He also added that “In moving to level 1 so soon, we will be one of the first countries in the world to have experienced a COVID outbreak and then return to that level of normality so quickly.”

According to recent news, A new “game-changing” app released worldwide today aims to detect whether someone has Covid-19 before they develop symptoms. The app- dubbed alarm- has been created in New Zealand and Act leader David Seymour plans to push for Government support in Parliament next week.

In the US, Tens of thousands of protesters took to the streets of New York, Philadelphia, Atlanta, and Los Angeles, as well as Washington, DC, to protest against last week’s killing in Minneapolis of an unarmed black man at the hands of a white policeman. There is nationwide civil unrest in the US which has impacted all sectors of the economy in the US.

NZD/USD 4 Hour Chart:

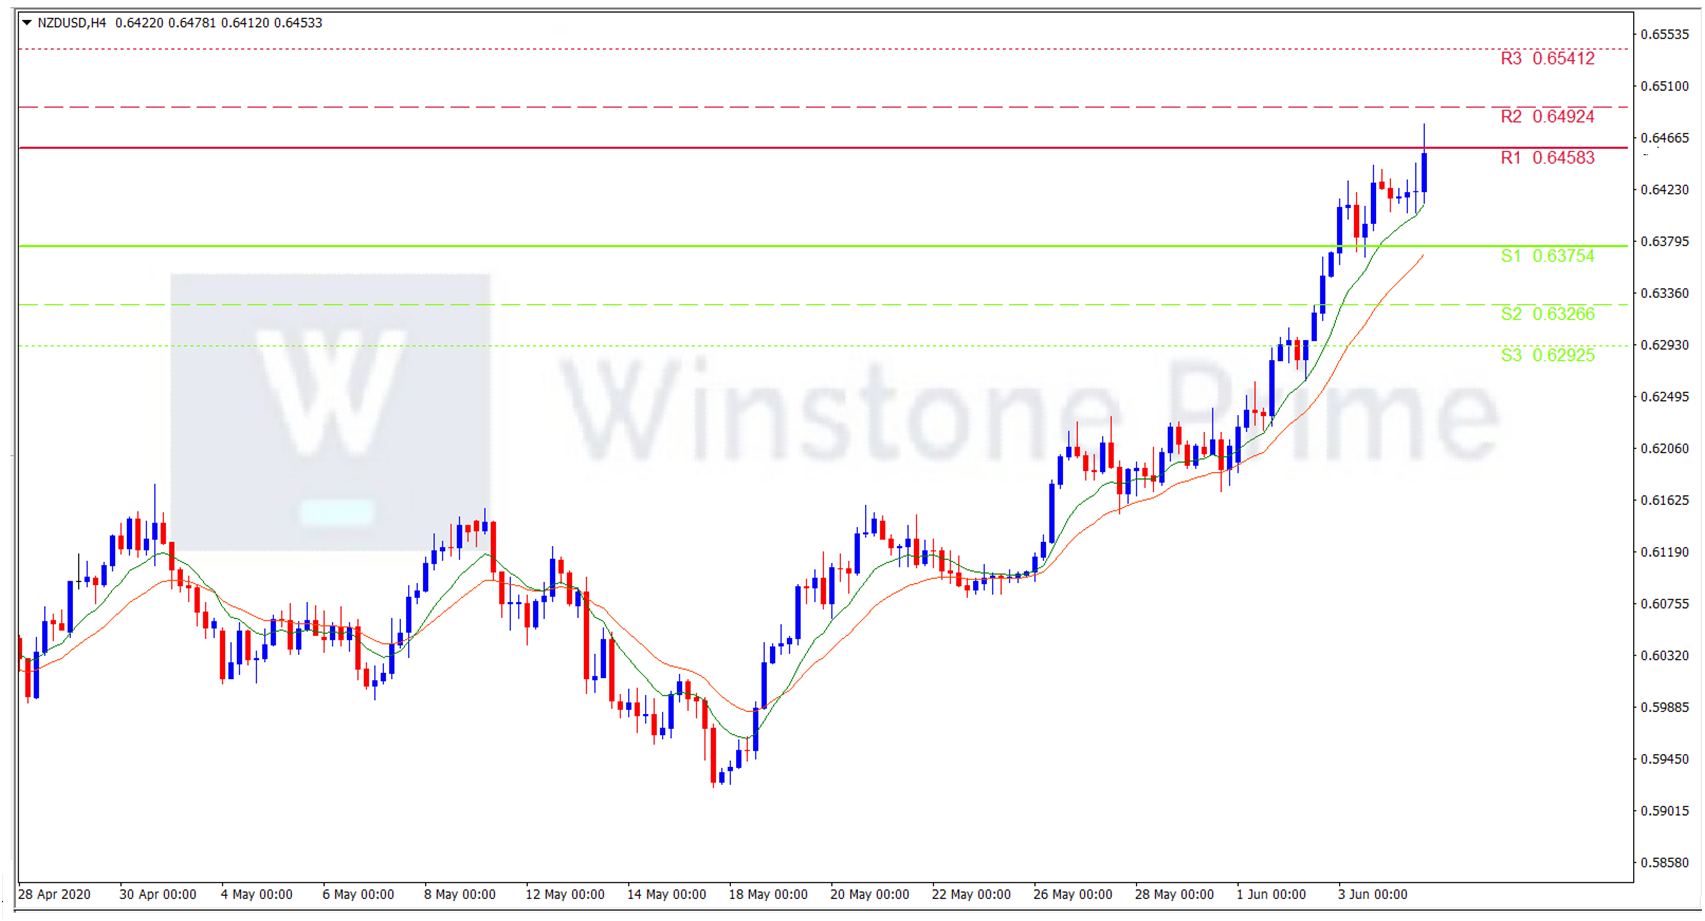
Support:  0.6375 (S1), 0.6327 (S2), 0.6293 (S3).

Resistance: 0.6458 (R1), 0.6492 (R2), 0.6541 (R3).

Amid all these catalysts favoring Kiwi, New Zealand Dollars surged to the upside. There is a jump in Kiwi as risk appetite grew based on optimism about the global recovery. The positive sentiments of a fast global economic recovery from the collapse induced by the corona virus have increased the risk appetite among the traders and they started to concentrate on the riskier assets. Even the recent global stimulus like Hongkong autonomous, unrest civil in the US has given buyers this direction. We expect a buy trend for the pair.