Uplifting of lockdowns in Japan but other sentiments work for Yen

USD/JPY maintains in a bullish trend. USD/JPY reaches from the intraday high near 107.80 to 107.65 in the early trading session on Monday. Japan’s Economy Minister Nishimura is about making an announcement that the lockdown will be lifted in Tokyo, Kanagawa, Hokkaido and Saitama. Also Japanese government is ready to provide another aid package worth $1 trillion for the overcoming the coronavirus effect, but US-China remains the main concern for the traders

Global policymakers are against china which is led by US diplomats since China is ready for Hong Kong’s autonomy at the 13th National People’s Congress (NPC).

China’s Global Times continues to use harsh words for the recent US decisions as more political. The US policymakers are framing a bill that would restrict Chinese companies’ listing on the American exchanges. Additionally, the Trump administration is also waiting for White House approval to sanction Chinese diplomats in the Xinjiang case.

Further, Japan’s Leading prior Economic Index 83.8 and Coincident Index 90.5 could be a catalyst in setting the direction of the pair, but we should not forget that US-China remains the main catalyst in the market.

USD/JPY 4 Hour Chart:

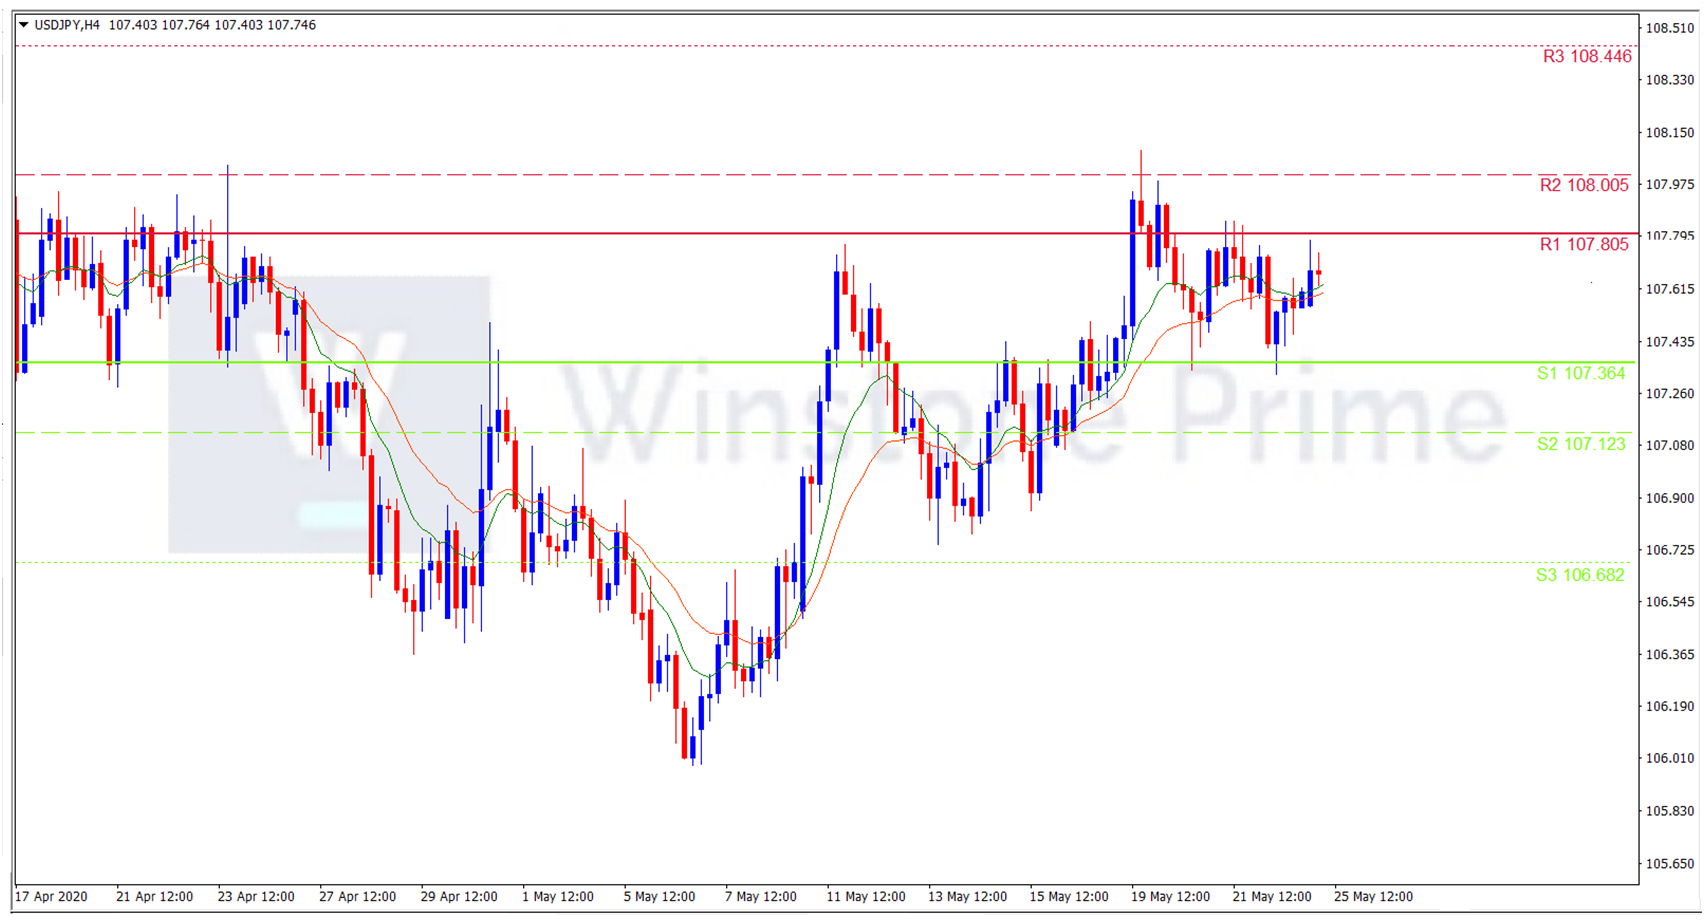
Support: 107.36 (S1), 107.12 (S2), 106.68 (S3).

Resistance: 107.80 (R1), 108.00 (R2), 108.45 (R3).

The market tensions have created a bullish trend for USD/JPY.

Daily High Low Trading Strategy

The daily high low trading strategy is based on a simple concept. If price breaks yesterday’s high or low, it will most likely continue in that direction of breakout.

If you are trading a breakout of a candlestick that is larger than many that came before it, you may actually be taking a trade but get caught in the mean reverting tendency of the market.

This trading strategy works as :

Place 2 pending stop orders (buy stop or sell stop) to catch whichever direction the breakout happens.

Timeframes :  Best on4hr charts and above.

Instrument : You can use this strategy Majors currency pairs.

Indicators : You need Yesterday High & Low Indicator or mark it.

Trade Management :

  • Once yesterday’s daily candlestick closes, place two pending orders 2 pips away on both sides. One sell stop pending order to catch the breakout downward and one buy stop pending order to catch the breakout upwards.
  • Place your stop loss at halfway distance of that closed daily candlestick.


Take Profit :

Average the last 3 days range and use it as your profit range.

For example, if 120 pips is the range (high-low)  of day 1st day candle, day two had 90 pips and day 3 had 150 pips, then the average of these three days would be 120 pips then you should set Take profit at 120 pips if it more than stop loss pips. If 120 pips is less than stop loss pips then place take profit same as stop loss pips.

Pros :

  • You can set and relax. You just need to check the trade progressing once a day.
  • Easy to use and understand, Good strategy for beginners.
  • Stop you from over trading.


Cons :

  • Large stop loss distances so use position sizing to minimize your risk.
  • Sometimes the market will activate one pending order and then the price is going to opposite direction heading for your stop loss.

USD/JPY Drop of 107.60 from 107.72 after BOJ meeting

A drop of 107.60 from 107.72 has resulted after BOJ’s inaction. The Monetary policy was left unchanged in the meeting hours after the emergency price review. Targeted aids for the small and mid-sized firms were extended. Like most central banks, there was no change in the short term interest rate and BOJ pledges to buy as many bonds as needed to keep 10-year government bond yields around 0 percent.

Adding to it, the 13th National People’s Congress (NPC) of China concerning Hongkong also increases the risk in the market. “A further crackdown from Beijing will only intensify the Senate’s interest in reexamining the U.S.-China relationship,” McConnell said in a statement.

Also, it is to be noted that the US 10 year treasury yield is better compared to that of JAPAN’s treasury yield.

We expect a bullish trend for the pair, If there bull continues then it can break at 107.81 (R1) resistance line and aim for the 108.02 (R2) resistance level. If the bears take over, we could see the pair breaking the prementioned upward trendline, the 107.43 (S1) support line and aim for the 107.26 (S2) support level.

USD/JPY 4 Hour Chart:

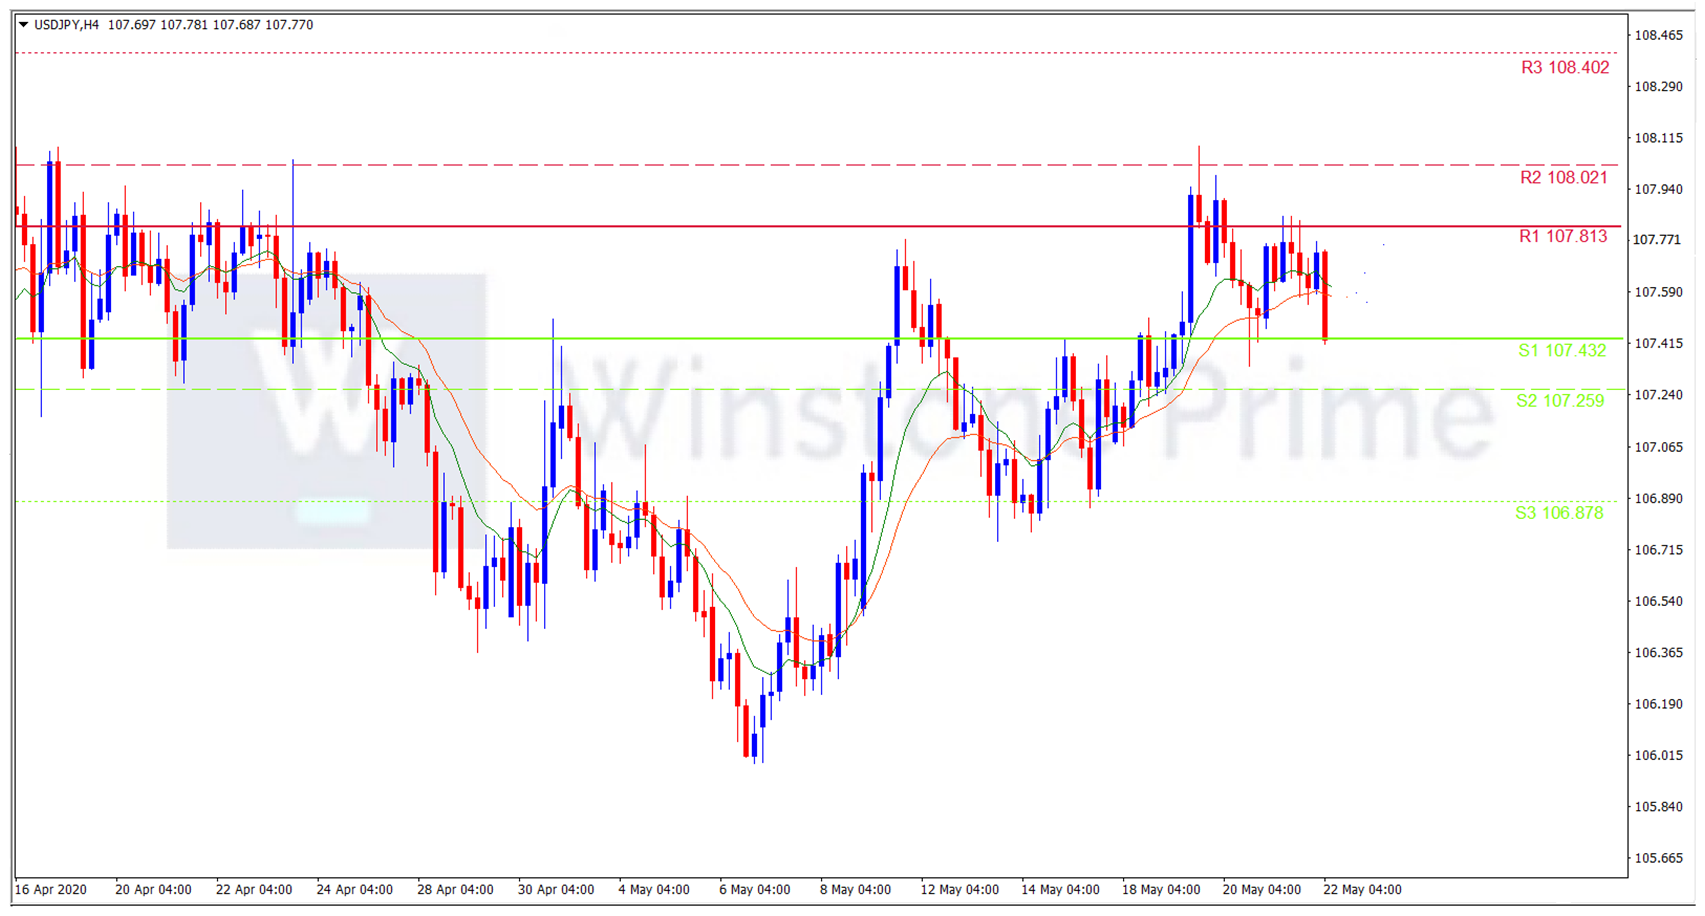
Support:  107.43 (S1), 107.26 (S2), 106.88 (S3).

Resistance: 107.81 (R1), 108.02 (R2), 108.40 (R3).

Considering all the above catalysts it should be noted that we expect a bullish trend for the pair.

Escalation of US-China warns the market

As the demand for the US dollar, AUD/USD is fast closing, it favors the short entries. The demand for the US dollar raises because of the US-China tensions escalations. President Trump accuses China of running a massive disinformation campaign and making the coronavirus spread all around the world.

A downtrend for the pair increases also due to the WHO warning that early relax in social distancing measures did not help in a surge of inflection flow. Adding to its Reserve Bank of Australia’s governor Lowe speech about the bond purchases also makes the AUD/USD low.

The US dollar index (DXY), a gauge of the greenback versus the major currencies, makes a recovery from 14-day low and adds extra pressure on the pair.

AUD/USD 4 Hour Chart:

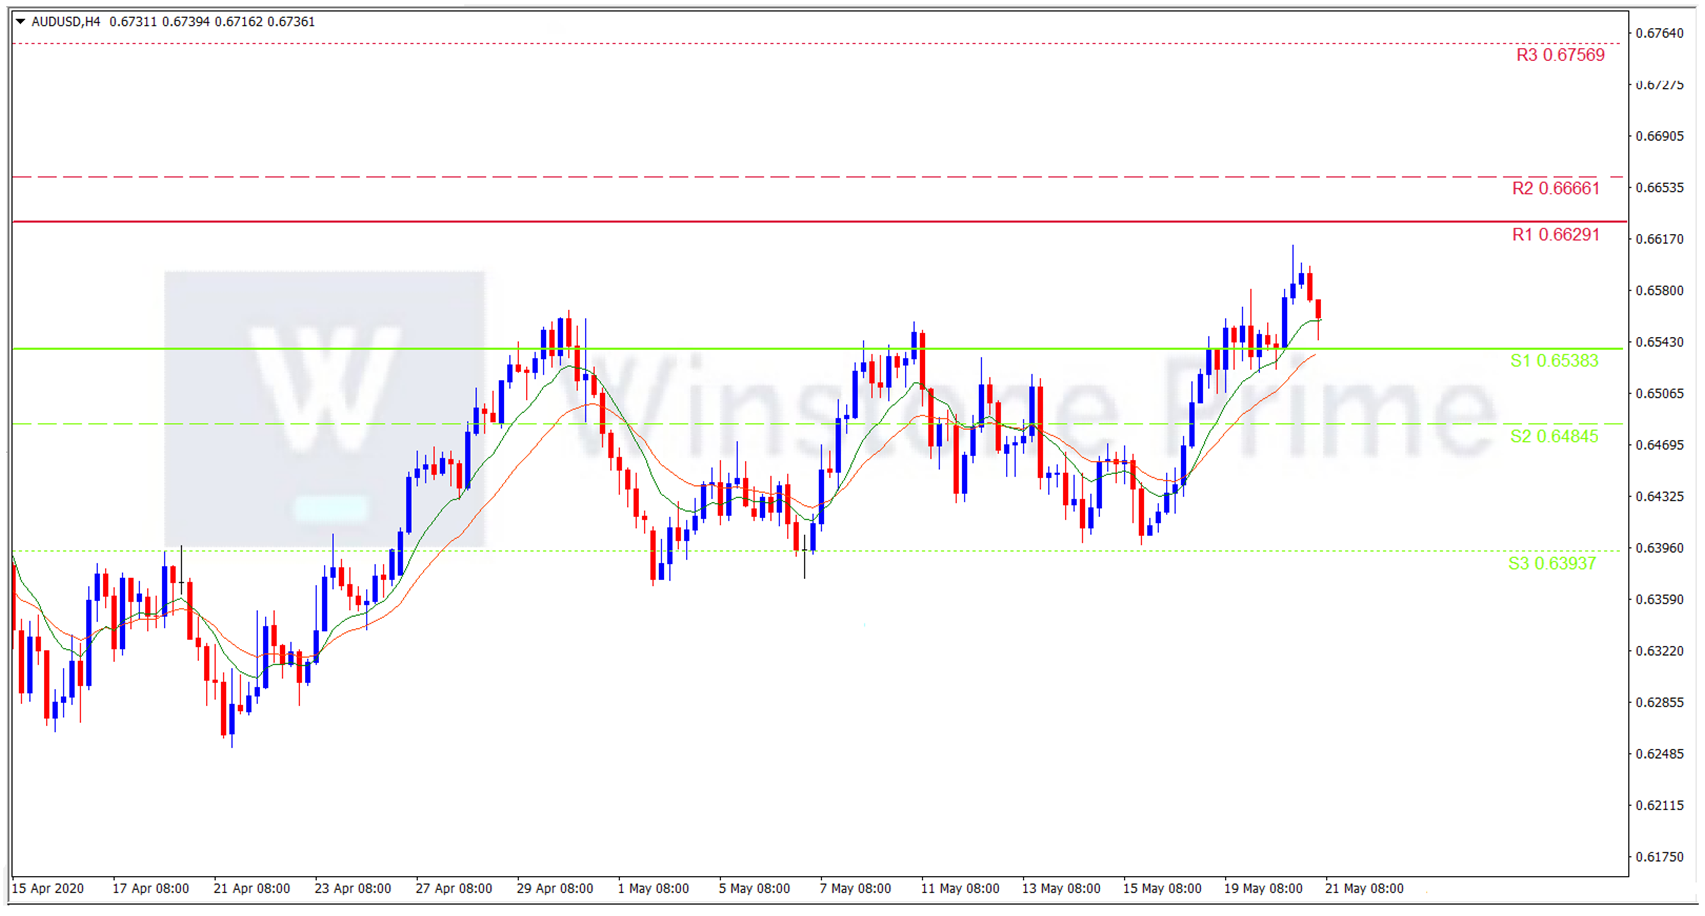
Support:  0.6538 (S1), 0.6484 (S2), 0.6393 (S3).

Resistance: 0.6629 (R1), 0.6666 (R2), 0.6757 (R3).

There is a down of 0.70% in AUD/USD. It remains offered and leads intraday low to 0.6551 and the pair extends to previous fall mainly focused on US dollar turn tail and we expect the bearish trend for the pair.