CPI puts GBP under pressure

Consumer price index (which shows the cost of living) for the month of April in the UK is about to be released by Wednesday early. The inflation numbers will be the catalysts for the pair GBP/USD as it considers the survey period that includes the lockdown of the virus period.

CPI inflation is expected to reach 0.8% on an annual basis, less than the previous of 1.5%. The Core CPI which excludes food and energy items are likely to have risen by 1.5% YoY last month compared to the previous rise of 1.6%.

Amid all these, USD’s increase in strength against its counter currencies puts pressure on the pair these factors encourage us to predict a bearish trend for the pair.

GBP/USD 4 Hour Chart:

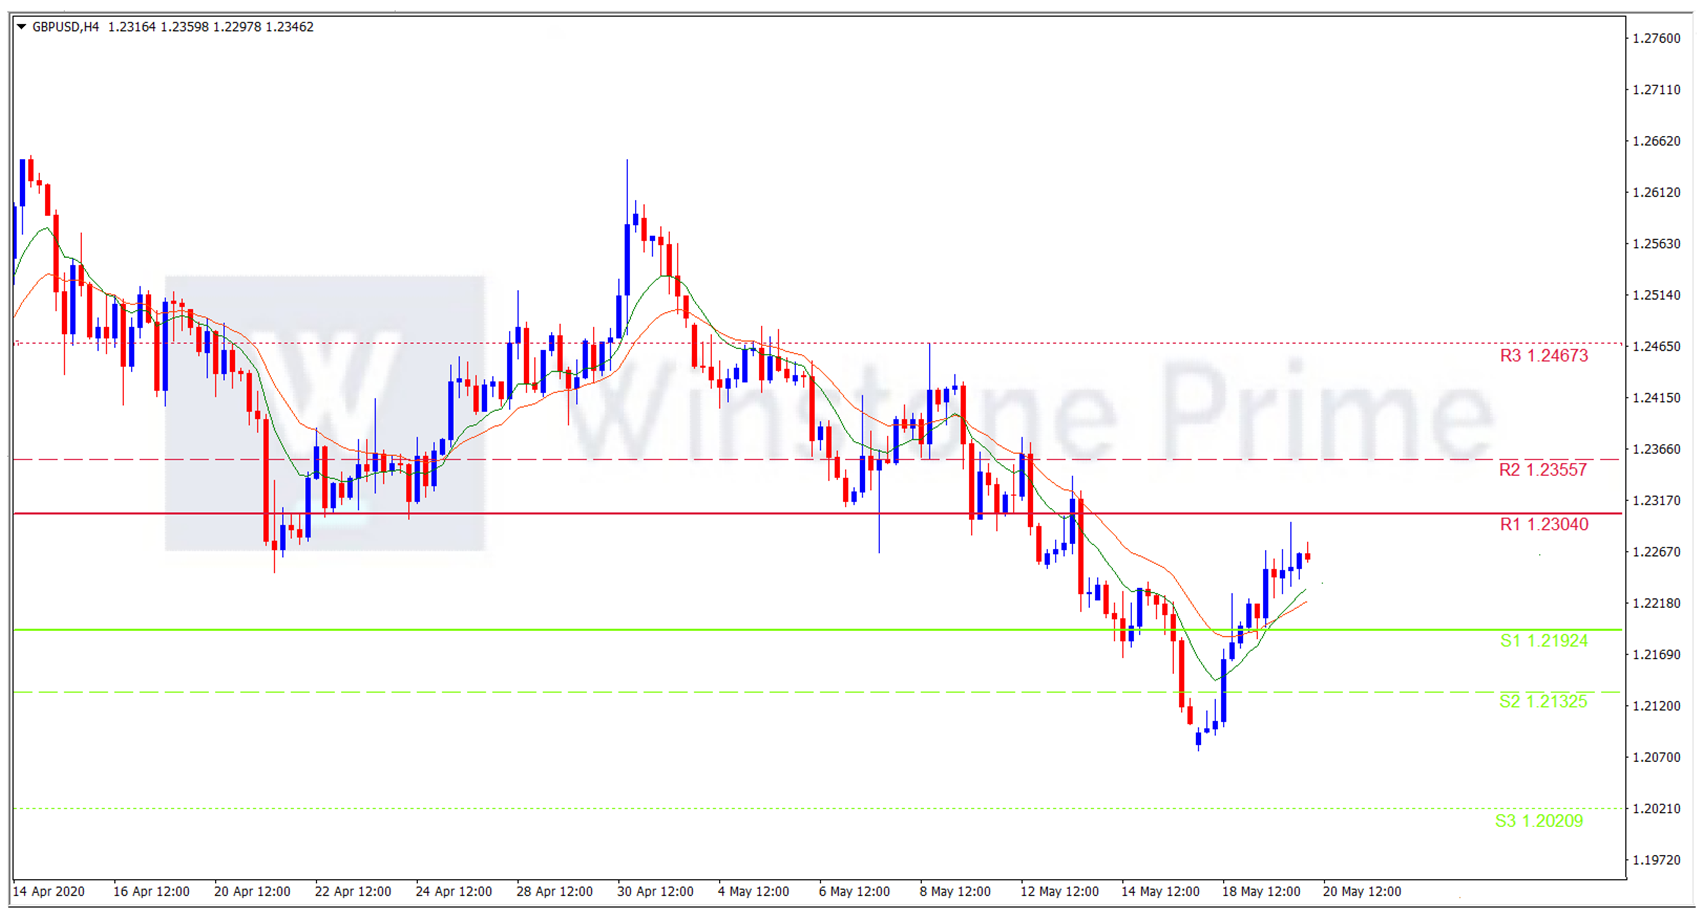
Support: 1.2192 (S1), 1.2133 (S2), 1.2021 (S3).

Resistance:  1.2304 (R1), 1.2356 (R2), 1.2467 (R3).

We expect a bearish flow for the pair, If the bear trend continues we could see GBP/USD breaking 1.2192 (S1) and aim for next 1.2133 (S2) and if the bull markets takes over then we can expect it to break at 1.2304 (R1) and aim for 1.2356 (R2).

Release effect of RBA minutes in AUDJPY

AUD/JPY drops to a low of 70.15 still up of 0.17% on a day, after RBA released minutes of its May month monetary policy on early Tuesday but later on stepped back on the Aussie-China tension.

Before the latest Aussie-China war, markets were happy cheering the hopes of the corona virus (COVID-19) cure. The relationship between Australia and China is at a low point following the threat to boycott Tourism and exports and proposed an inquiry in the origin of corona virus. Liberal-National coalition pushed for a transparent investigation of the spread of the virus.

On Tuesday early warning in Asia, China’s Ministry of Commerce confirmed 80% tariffs on Australian barley for five years on anti-dumping grounds which added to the down for the pair which seems to be a response for the Aussie PM Scott Morrison’s push for the investigation.

The payroll jobs fell to 7.3%. The latest data shows a further slowing in the fall in COVID-19 job losses between mid-April and early May. Some industries were now showing a reduced impact in the most recent weeks.

Considering all the factors we expect a bullish trend for the pair. If there bull continues then it can break at 69.60 (R1) resistance line and aim for the 70.11 (R2) resistance level. If the bears take over, we could see the pair breaking the prementioned upward trendline, the 68.73 (S1) support line and aim for the 68.38(S2) supportlevel.

AUD/JPY 4 Hour Chart:

Support: 68.73 (S1), 68.38 (S2), 67.51 (S3).

Resistance:  69.60 (R1), 70.11 (R2), 70.98 (R3).

The release of RBA minutes favors the pair and sets a bullish trend.

US-China tension puts kiwi under pressure

NZD/USD drops to 0.5930 on Monday. Efforts of the Federal system to strengthen US dollar and the US-China tension has lead to keep the pair in a bearish trend. Even New Zealand’s Business NZ Performance of Services Index (PSI) for April has added for the downside of the pair. The figures drop to 25.9 from 52.00 registered in February.

The Fed Chair Jerome Powell’s speech that recovery can take a while but don’t bet against American Economy and US President Donald Trump tweet “The number of Coronavirus cases is strongly trending downward throughout the United States, with few exceptions. Very good news, indeed!” has added to the strength of USD.

Also, the US-China tension plays a vital role among the global market players. US President continuously alleges China for the outbreak of coronavirus and on the other hand, China’s Global Times’ Editor called the dragon nation to develop nuclear weapons to possess enough capability so that the US will not proactively attack China.

All these catalysts have given kiwi this direction.

The pair fell by 3.34% last week to register its biggest weekly decline since the third week of March. More importantly, the last week’s candle has taken the shape of a big red marubozu candle, which is also engulfing the preceding week’s trading range.

NZD/USD 4 Hour Chart:

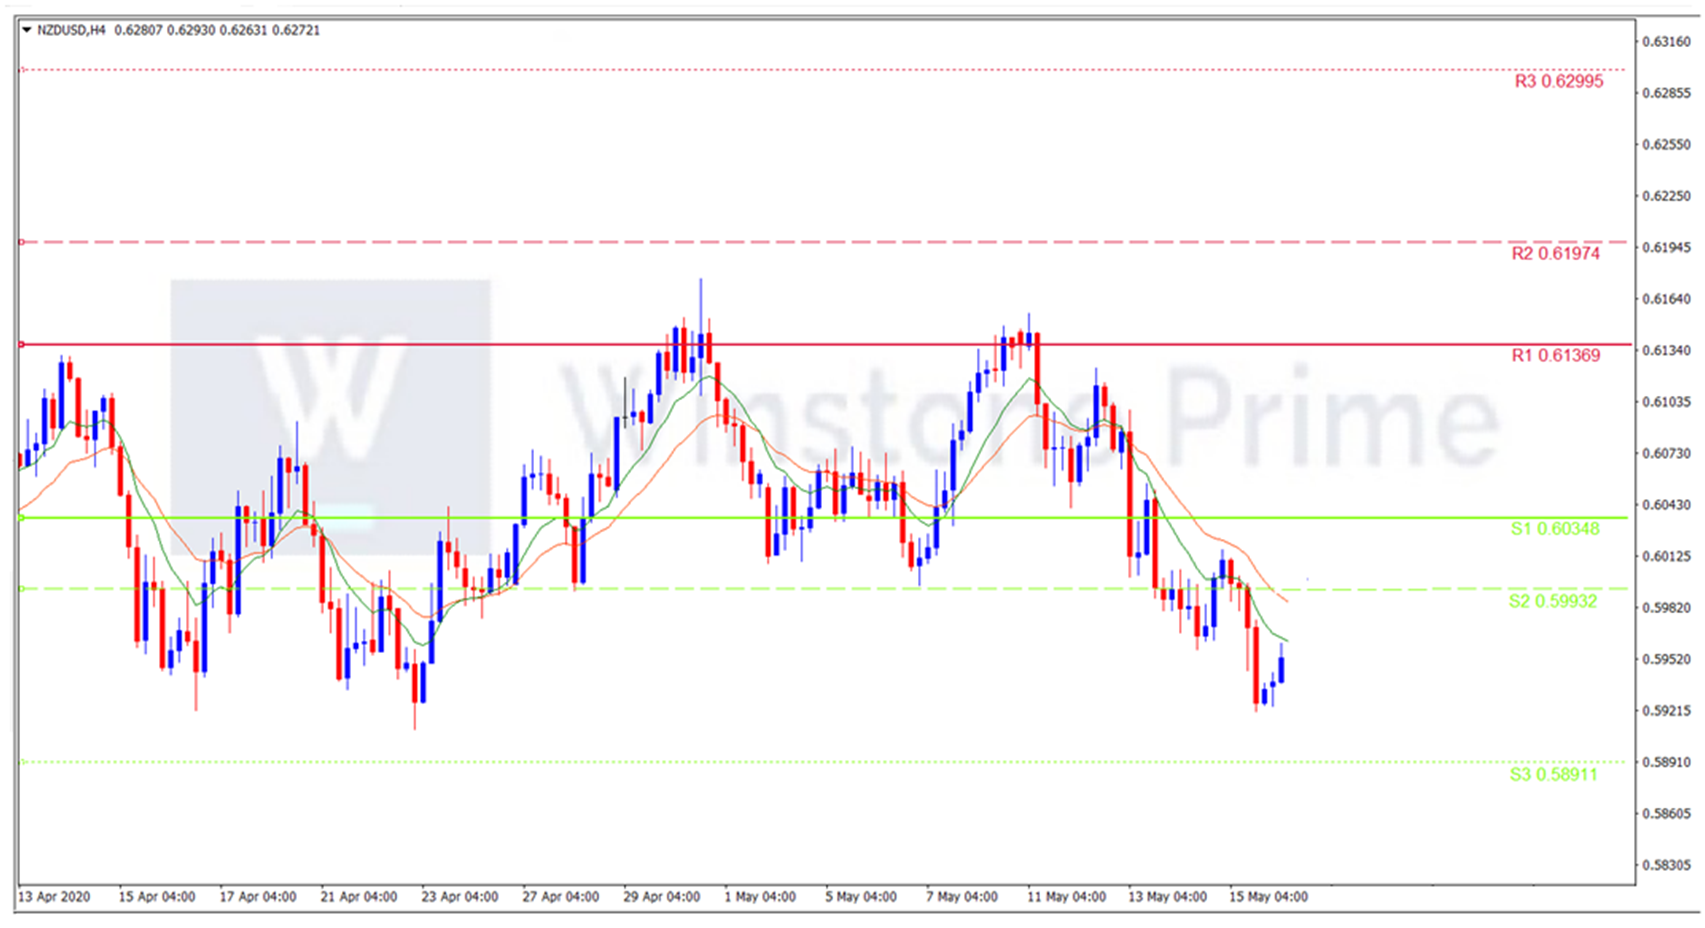
Support: 0.6035 (S1), 0.5993 (S2), 0.5891 (S3).

Resistance:  0.6137 (R1), 0.6197 (R2), 0.6300 (R3).

It is expected that kiwi will be in a bearish trend for a while.

10 And 20 SMA with 200 SMA Crossover Strategy

This swing trading strategy is a comprehensive and simple approach in trading higher timeframes such as 4-hour and daily timeframes. This system uses a moving average which determines a trend direction and trend change.

The 10 And 20 SMA with 200 SMA trading strategy is one of the simple fx trading strategy that is quite easy to understand and implement.

This trading strategy works as :

  • Uptrend is indicated if the 10 EMA crosses above 20 EMA.
  • Downtrend is indicated if the 10 EMA crosses below 20 EMA.
  • EMA 200 is used to clearly identify the main trend.


Timeframe :  4hr timeframe and the daily timeframe.

Instrument : can use this strategy for any currency pairs.

Indicators : You need 10 SMA, 20 SMA, &200 SMA.

Long Entry :

  • Go long when 10 EMA must cross above the 20 EMA.
  • 10 EMA and 20 EMA are above the 200 EMA.
  • Place buy stop order 5 pips above the high of the bullish reversal candle.
  • Place stop loss at least 5 pips below the low of the bullish reversal candle.


Short Entry : 

  • Go short 10 EMA must cross below the 20 EMA.
  • 10 EMA and 20 EMA are below 200 EMA.
  • Place sell stop order 5 pips below the low of the bearish reversal candle.
  • Place stop loss at least 5 pips above the high of the bearish reversal candle.


Take Profit :

Take profit at 1:2 risk and reward ratio or at the previous swing high or low.

The Use of Moving Averages :

There are two main reasons why moving averages are useful in forex trading:

  • Moving averages help traders define trend
  • Recognize changes in trend.


Pros :

  • Simple and easy strategy to follow
  • Easy to automate.
  • Very profitable strategy in trending markets.


Cons :

  • Doesn’t work well in ranging markets so can lead to numerous false signals. Hence avoid using in ranging markets.
  • Monitor after every new bar has closed. Wait till the current bar to be closed to take any action. Signals can change frequently when you are watching the graph tick by tick.