Support and resistance

Introduction

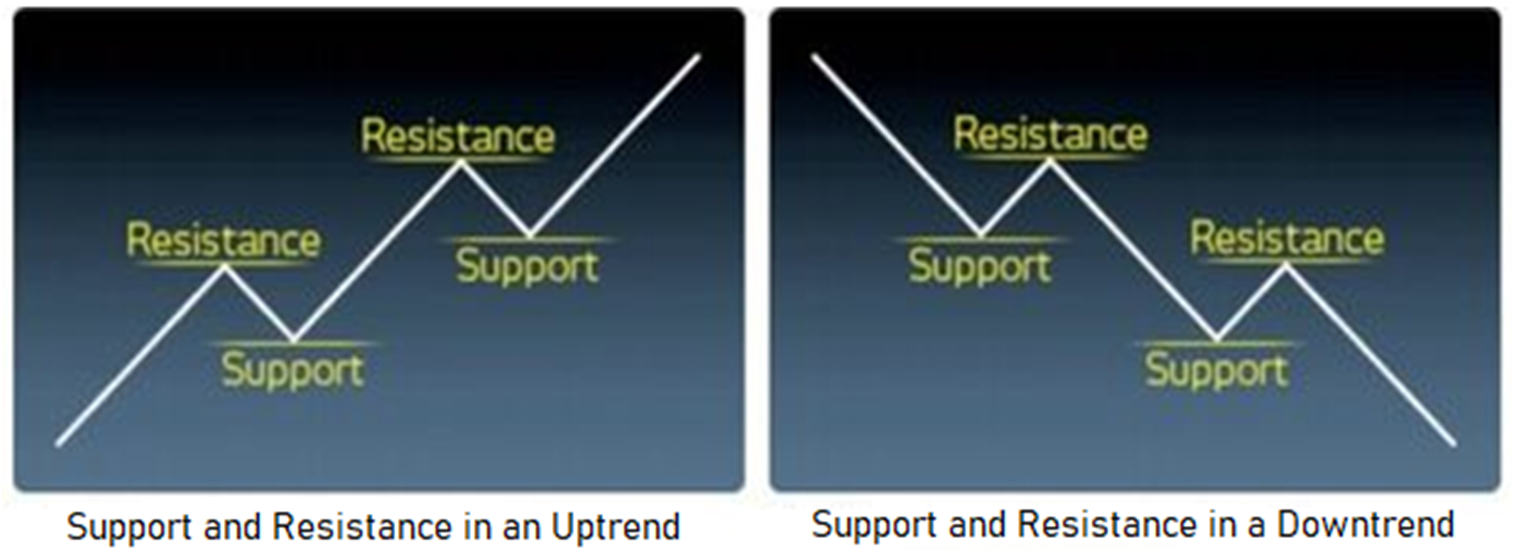
Support, as the name implies, indicates a price level or area on the chart under the current market price where buying interest is sufficiently strong enough to overcome selling pressure. As a result, a decline in price is halted and prices are turned back up again.

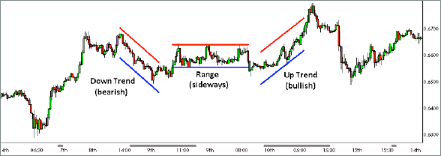
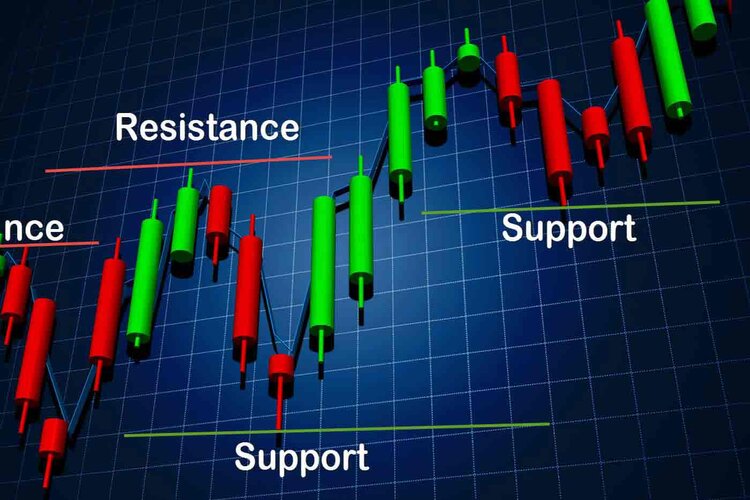
The troughs and peaks of trend lines are also known as support and resistance levels respectively. The identification of these levels represents one of the most important skills in technical analysis.

Resistance is the opposite of support. It represents a price level or area above the current market price where selling pressure may overcome buying pressure, causing the price to turn back down against an uptrend. It should be emphasised that an existing prior high does not imply that subsequent rallies will definitely fail at or below that high with pin-point accuracy, but rather that resistance could be anticipated in the general area.

Finding support and resistance involves determining what critical prices define the trend or range and are more important over and above other prices. There are guides and rules for determining the legitimacy and strength of a price level, irrespective of whether it is a support or resistance. These include:

  • Times tested: where a price level has been ‘tested’ (traded) at or near, several times, it may be remembered by participants. For example, traders may not sell into a low or trough if past experience has shown this is not wise.
  • Volume spent: following on from the above point, if large amounts of volume have been transacted at or near a certain level, this also tends to be considered and noted by participants in the market.
  • Recent trading: the more recent the trading at a certain level, the more relevant the level is to an analysis of market price.
  • Round numbers: for reasons more to do with psychology than anything else, traders (and people in general) tend to remember ‘round numbers’. 


One of the best uses of support and resistance is for entry and exit of positions coupled with efficient risk management setting. Some of the practical uses include:

Take profit. This is the price at which one takes the profit available on a position. That is, as the price approaches a support (from above), short sellers may take profits on their positions. Conversely, as price approaches a resistance (from below), long traders may take profits.

Establish a new position near an unbroken level.When the price approaches the support level, a technically driven investor would tend to pitch limit buy orders near and above a defined support and, conversely, would pitch limit sell orders near and just under resistance levels.

Establish a new position on the break of a level. When a support breaks, one can initiate a short position on the technical expectation that prices will then go onto the next (lower) support level. Conversely, if a resistance breaks, one could buy on the expectation that prices will move on to the next (higher) resistance, if there is one.

Stop-loss setting. A breach of a level can be used to limit loss too. Rather than using a break of a support or resistance level as an opportunity to establish a new position, you can also use it to minimize loss. A losing position should be immediately exited. The signal to do so comes from the breach of the support or resistance level. 

Once broken, support and resistance levels reverse roles. This is a key aspect of support and resistance identification: once a level (whether support or resistance) is broken, the technical characteristic of the level is reversed. That is, a broken support now becomes a resistance and a broken resistance now becomes a support. This can be seen in below figure.

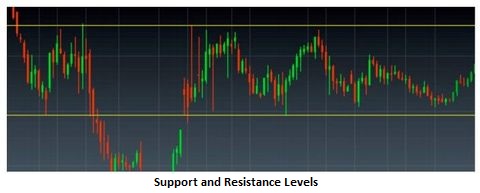
One of the most useful technical patterns is a sideways trend, or range. It allows a simple, mechanical strategy to be followed as detailed below.

The first step is to identify the support and resistance that bound the current and recently observed price action. Once this is done, the theory is to pitch the buy and sell orders appropriately, near and above the support and near and just under resistance levels respectively. After this is done, it is prudent practice to apply stop losses (exit orders for example) to the buy (or sell) orders.

An example:
​A basic example of a trade plan, with a planned limited risk (for instance the difference between our orders and the exit), for a hoped for return. There are two possible scenarios that may follow on from this plan:

If the trade plan outlined in figure 2 is used and a sell position is entered into, one of two events will occur. They are outlined in figures 3 and 4. Figure 3 shows the ideal scenario. A short (sell) position was entered into at the top of the range, near the high and resistance level, with a stop loss on the other side of resistance.

From the selling point, the price falls back to the lower end of the range and the take profit order (near support) is triggered and the position is exited with a profit.

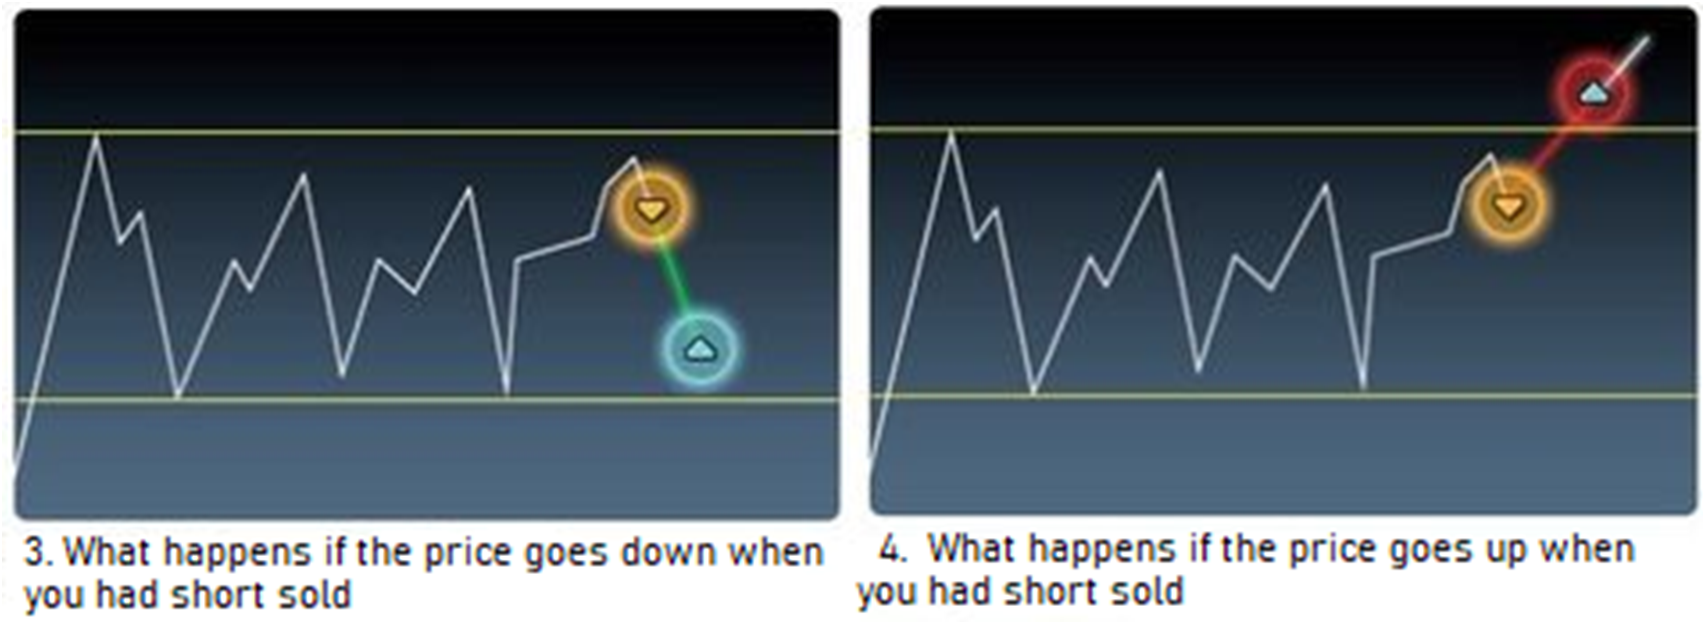
Figure 4 shows the scenario to avoid, but that you must be prepared for. A short (sell) position was entered at the top of the range, near the high and resistance level, with a stop loss on the other side of resistance. From the selling point, the price rises back to, and through, the upper end of the range, instead of falling. In doing so, it hits and triggers the stop loss. This position is therefore exited with a loss. Note: please be aware that this is a very basic outline of a possible trading plan. You should never stop learning and practicing in this area.

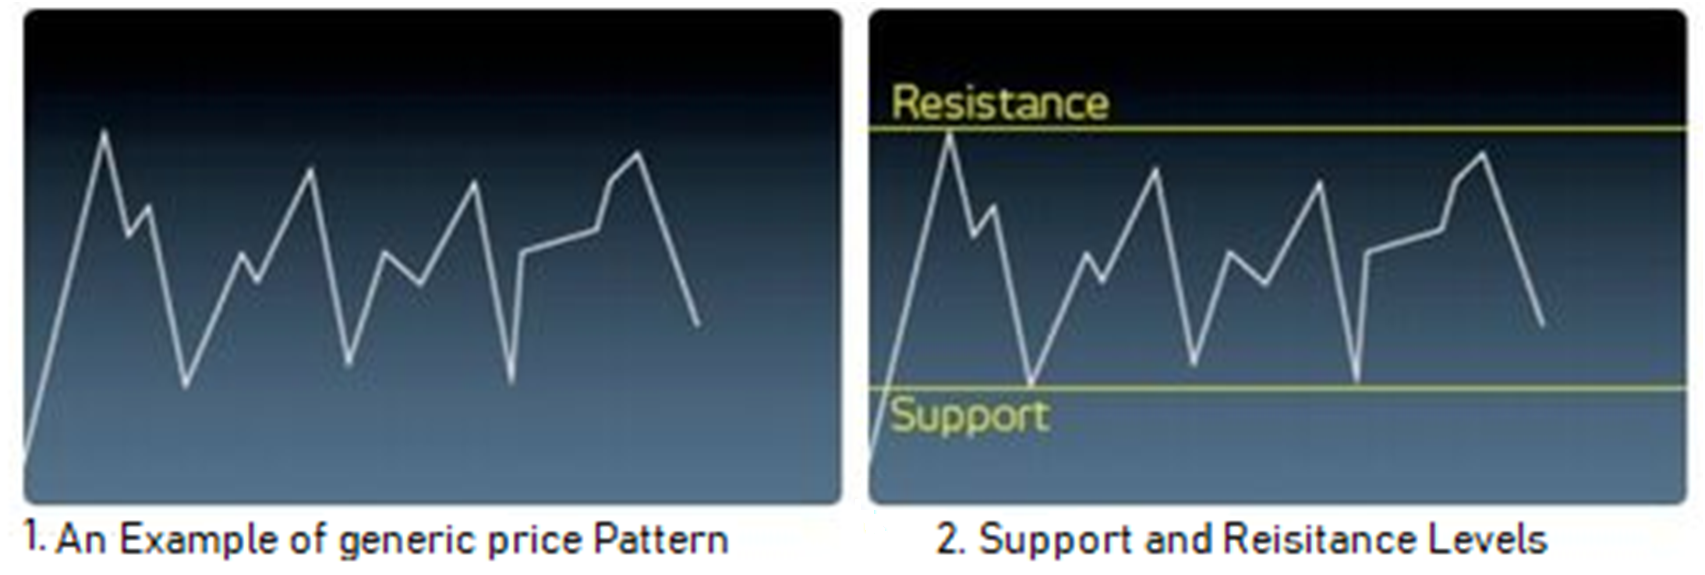
1. This is a theoretical example of a trade plan, driven by identification of support and resistance

2. The application of buy and sell orders based on point 1.

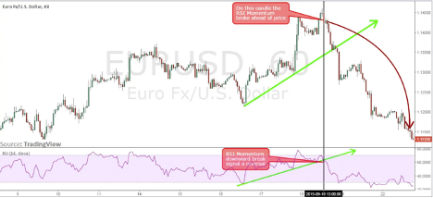
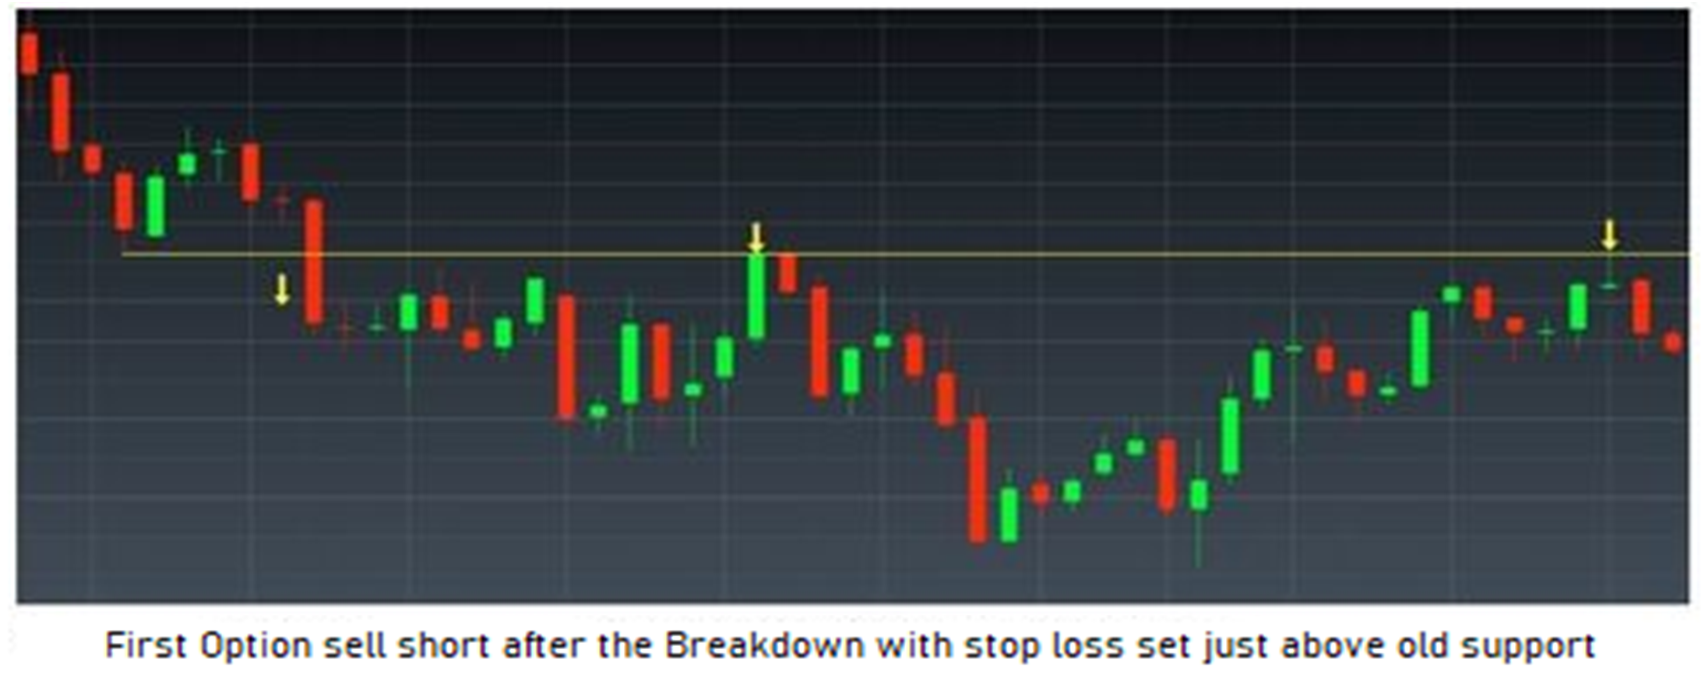
3. The application of stop loss measures to limit risk and safeguard performance. Below, the schematic method shown in figures 3 and 4 has been applied to a practical (but historic) trading plan and market.

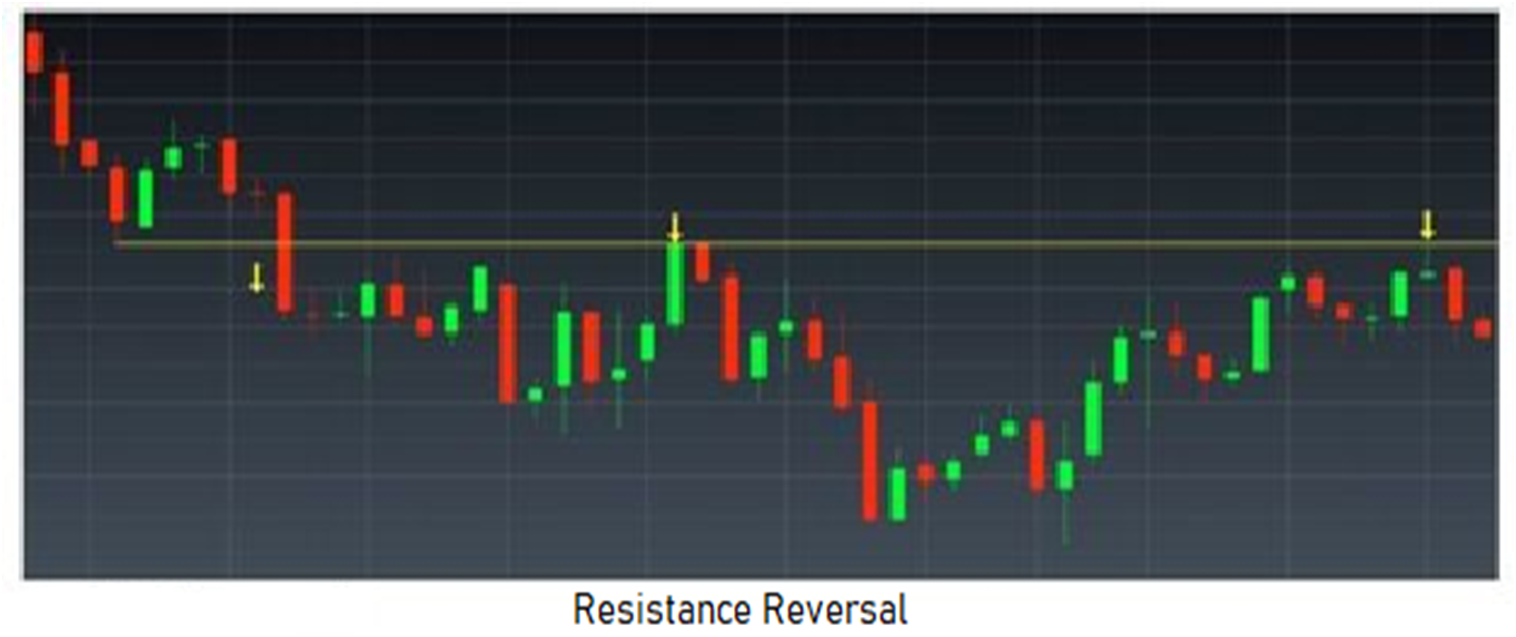
In this example a support has been broken and the price has dropped much lower. Over time the price action has recovered to just below the old support, which is now expected to have reversed, to become a resistance level.

There are two options. The first is to short sell just below the resistance with a stop loss on the other side anticipating a drop in price. The second is to wait to see if there could be a technical breakout (where the price breaks the resistance) and a buy order can be entered just above the breach with a stop loss slightly below the old resistance (now expected to act as support).

Some additional key patterns to look out for: 

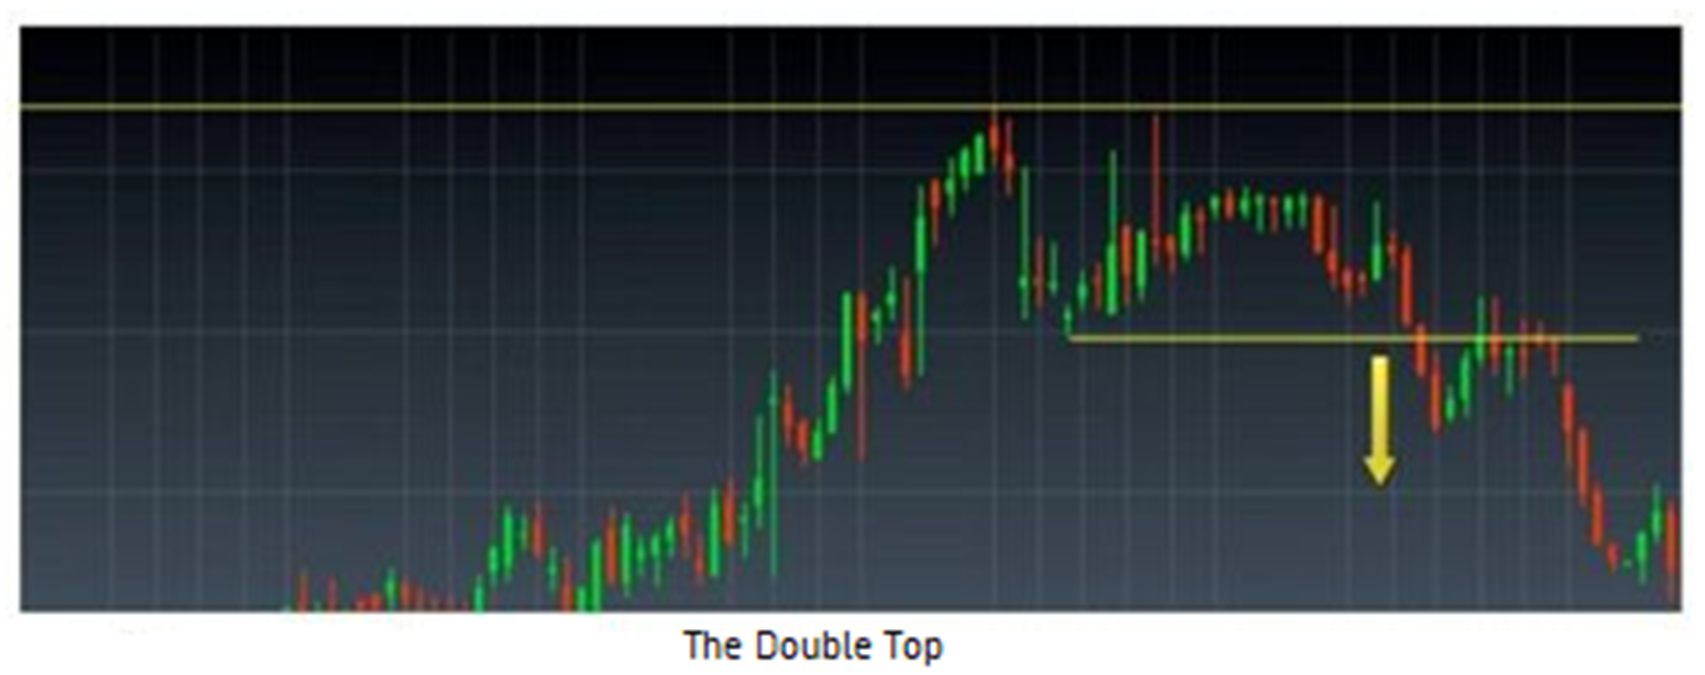
​The pattern in above figure is known as a ‘double top’. It is a range pattern, where there are two distinct tests of resistance, which are then followed by a fall in price back down to the support level of the defined range, which is then breached. Note that the name of the pattern is not as important as the fact that a key identified level (in this case a support) was cut, or breached. There are elaborations of such patterns. If, for instance, there were three distinct tests of the topside (or resistance), followed by a price fall that actually breaks the support of the range, this would be called a ‘triple top’.

A pattern is ‘confirmed’ once the support or resistance levels are broken. Otherwise it is only a probable or provisional pattern.

Is forex trading better than the stock market

Why is the Forex Market better than stocks? Why is a dollar better than a nickel? Because it’s worth a lot more. That is one of the most basic and obvious answers to this question. The Forex Market is where the largest volume in trading is going on, with an incredible amount of nearly $2 billion worth of trading in a 24 hour day. There is a fortune that can be made in trading Forex because the Forex market is constantly trading.

The forex and stock market are two of the largest trading markets, and traders often wonder which one is the better option. For all the attention surrounding the stock market, trading forex is much better. In all cases, Forex  trading as the best way to raise your income or even get a new, simpler full-time job. That’s just one of the many advantages of the forex market over the stock markets. Here are a few more:

Higher Trading Volume and Liquidity

In comparing stock and forex trading, there are several talking points to consider. Although we see the stock market as the be-all, end-all of trading markets, in truth no stock market can hold a candle to the Forex market in sheer size. While the stock market trades about $200 billion per day, a staggering amount wherever you put it, the Forex market goes even higher, averaging $5 trillion per day. That’s more than several tens the magnitude of the stock market.

While sheer size might not tell us much at first, it matters a lot – particularly once we also consider that the Forex market is highly liquid. A large trading market with high liquidity means it’s much easier for anyone to enter or leave the market, since the expectation is that whenever you want to trade there will be somebody willing to trade with you.

24-Hour Market 

The stock market is limited to an exchange’s opening hours. For example, in the U.S., most stock exchanges open at 9:30 am EST and close at 4:00 pm EST. The forex market is a seamless 24-hour market. Most brokers are open from Sunday at 5:00 pm EST until Friday at 5:00 pm EST,  With the ability to trade during the U.S., Asian, and European market hours,

you can customize your own trading schedule and it has no single central location; therefore, participants are spread across the globe; and there is always a part of the market that is in business hours.

Lower spreads on forex

Spreads, the difference between the bid and ask price are on average smaller compared to stocks. Although some large cap stocks such as Apple have tight spreads, it is not the case with many other stocks that you can trade.

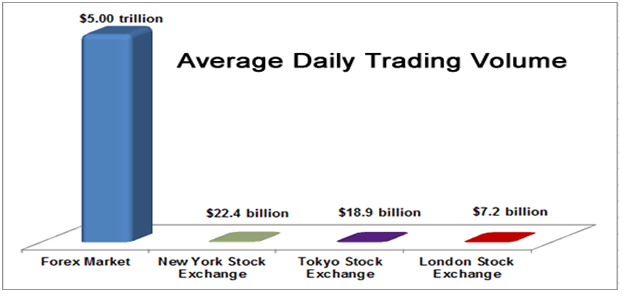
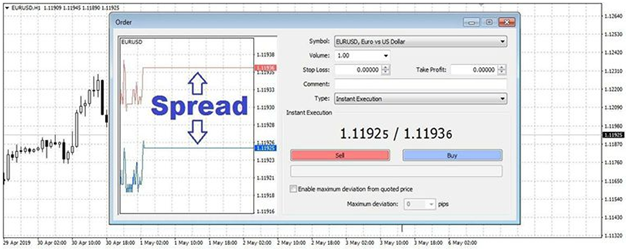
In the forex markets, the major currencies involving the EUR, USD, GBP, JPY, CHF and CAD come with tight spreads due to the volumes that these currency pairs enjoy. Thus in the longer term, the spreads are a lot cheaper compared to trading stocks.

Minimal Market Manipulation

How many times have you heard that “Fund A” was selling “X” or buying “Z”? The stock market is very susceptible to large fund buying and selling. With currency trading, the massive size of the forex market makes the likelihood of anyone fund or bank controlling a particular currency very small.

The FX market is sufficiently liquid that significant manipulation by any single entity is all but impossible during active trading hours for the major currencies. Banks, hedge funds, governments, retail currency conversion houses, and large net worth individuals are just some of the participants in the spot currency markets where the liquidity is unprecedented.

No restriction on short selling

When a stock market declines, you can make money by shorting, but this imposes additional risks, one of which is that you may have unlimited losses. In reality, that’s unlikely to happen. At some point, your broker will end the short position. Nevertheless, most financial advisors caution against shorting for all, and many of the most experienced investors execute parallel stop-loss and limit orders to contain this risk.

Unlike the equity market, there is no restriction on short selling in the currency market. Trading opportunities exist in the currency market regardless of whether a trader is going for long OR short, or whichever way the market is moving. Since currency trading always involves buying one currency and selling another, there is no directional bias to the market. So you always have equal access to trade in a rising or falling market. In forex you can go short on a currency pair as easily as you can go long. The two positions present similar risks.

Conclusion

If you want to play the market, then forex will be the ideal place for you. This is partly attributable to market size – and also, because of how leverage works in forex vs the stock market. Each market might be better suited for one person or the other, but for a retail investor looking at short term gains, forex trading trumps the stocks.

Forex Market Analysis

Analysis of the market is not merely a part of trading; it is the essence of forex trading. In Forex trading, there are two main types of analysis – Fundamental analysis and Technical analysis. There is no answer to which technique is better as it depends on a trader’s preferences. In fundamental analysis, considers factors and events, opinions and policies that might impact the future value of a currency.

The second one Technical Analysis, involves the study of historic and current currency values and trading volume. The analysis of technical and fundamental, or blended-is to attempt to project currency price direction and identify trading opportunities.

Fundamental analysis is the study of how global economic news and other news events affect financial markets. It is a way of looking at the forex market by analyzing economic, social and political forces that may affect the supply and demand of an asset. Using supply and demand as an indicator of where price could be headed is easy. The hard part is analyzing all of the factors that affect supply and demand.

The idea behind fundamental analysis is that if a country’s current or future economic picture is strong, their currency should strengthen. A strong economy attracts foreign investment and businesses, and this means foreigners must purchase a country’s currency to invest or start a business there so essentially, it all boils down to supply and demand; a country with a strong and growing economy will experience stronger demand for their currency, which will work to lessen supply and drive up the value of the currency.

For example, if the Australian economy is gaining strength, the Australian dollar will increase in value relative to other currencies. One main reason a country’s currency becomes more valuable as its economy grows and strengthens is because a country will typically raise interest rates to control growth and inflation. Higher interest rates are attractive to foreign investors and as a result they will need to buy Aussie dollars in order to invest in Australia, this of course will drive up the demand and price of the currency and lessen the supply of it.

Generally speaking, traders buy currencies with stronger economies at a low price and sell currencies with underperforming economies. So, fundamental trading is most appropriate for two types of traders. Either those up-to-date on significant news events and can research thoroughly, or position traders.

In order to do fundamental analysis in the forex market, you need to follow recent developments about the currencies that you are trading. For example, when US central bank Fed hikes interest rates, dollar demand in the market will increase. Thus, US dollar will start gaining strength. Or when Bank of England cut rates, traders expect British Pound (GBP) to lose value. As you can see, interest rate decisions of every central bank cause change on the prices of the relevant currencies.

Let’s continue with another example. In order to do successful fundamental analysis about USD dollar, you need to follow economic releases like non-farm employment change, unemployment rate, GDP growth, inflation rate, interest rate decisions, and central banker speeches.

The easiest and quickest way for a trader to follow these economic data is the economic calendar.

In addition to economic data and central bank policies, domestic and international politics may have a big impact on the price of the currencies. A political instability or uncertainty such as general elections may cause a currency to lose value. Also, in the case of geopolitical risks such as war, investors tend to avoid the related currency and thus the currency depreciates.

Here is some additional reading to get you going.

  • The Economic Calendar: This calendar is going to be central to your trading strategy. A fundamental trader will always know when significant events are about to happen. There is no such thing as an unprepared fundamentals trader.
  • The US Non-farm Payroll Report: The US economy is a big part of Forex trading. The major currency pairs all include the US Dollar (USD), so any news that might affect its value will be big news. This jobs report is released at 08:30 (New York, USA) on the first Friday of the month, which is usually a big focus for fundamental traders.
  • EURUSD Analysis: Know the history of the pairs you trade, as you will see the same seasonal trends and repeat performances.

Here is an example of how the release of positive NFP (non-farm payroll) reports can affect the market. Should a trader expect this report to show robust job creation, we open a trade before the report is released and go long.

Traders have options of how long to keep the trades open for, as this will affect profitability. When a set profit target is reached, a trade can close automatically using a take profit order, or a trader will continue to monitor the data and try to extend the gain, and close the trade manually.

While Fundamental analysis is not chart based, it is essential to understand how to read charts to confirm that the trade is going in the direction expected. In the case below, the chart shows that the trader would have made 100 pips of profit in 5 minutes, and should they have kept the trade open longer, they would have made 200 pips of profit. Having held the trades open a little longer would have been a more profitable trade.

Technical analysis is the study of the price movement and patterns of a security. It goes hand-in-hand with forex charting. Technical analysis attempts to forecast future price movement through the mathematical analysis of past price action. For many traders, technical analysis is the most important tool for examining the market. Technical analysis involves the study of past and forex prices often though the use of charts with the objective of predicting future prices movements and trends, and identifying opportunities for profitable forex trading.

Various simple tools can be used in technical analysis, such as moving averages, trend lines and support levels, or the advanced trader might choose from a wide range of advanced analyses and theories including relative strength index, Fibonacci studies, cycles, and many more.

Technical analysis is the study of historical price action in order to identify patterns and determine probabilities of future movements in the market through

the use of technical studies, indicators, and other analysis tools. Technical analysis boils down to two things:

  • Identifying trend
  • Identifying support/resistance through the use of price charts and/or timeframes

Markets can only do three things: move up, down, or sideways.

Prices typically move in a zigzag fashion, and as a result, price action has only two states:

  • Range: when prices zigzag sideways
  • Trend : prices either zigzag higher (up trend, or bull trend), or prices zigzag lower (down trend, or bear trend)

Technical traders use a variety of tools and indicators to help them identify trends and patterns, and allow traders to identify high probability situations. These are ones in which the currency pair has a good chance of moving in a specific direction.

Experienced traders know how to turn a high probability trade into short-term profits, regardless of whether the market is moving up or down. The ability to make money in any market is one of the most significant benefits of CFD and Forex trading.

Technical analysis is based on the theory that the markets are chaotic (no one knows for sure what will happen next), but at the same time, price action is not completely random. In other words, mathematical Chaos Theory proves that within a state of chaos there are identifiable patterns that tend to repeat.

This type of chaotic behavior is observed in nature in the form of weather forecasts. For example, most traders will admit that there are no certainties when it comes to predicting exact price movements.

As a result, successful trading is not about being right or wrong: it’s all about determining probabilities and taking trades when the odds are in your favor.

Part of determining probabilities involves forecasting market direction and when/where to enter into a position, but equally important is determining your risk-to-reward ratio.

Remember, there is no magical combination of technical indicators that will unlock some sort of secret trading strategy. The secret of successful trading is good risk management, discipline, and the ability to control your emotions. Anyone can guess right and win every once in a while, but without risk management it is virtually impossible to remain profitable over time.

Here is some further reading to get you going with the basics.

  • Dow Theory: Dow Theory is the basis of all technical analysis, and is a good introduction to basic concepts.
  • Charts: This is the first part of a two-part series we have on charts. It will give you an introduction to chart types and how to compare periods. The second part is here when you are ready.
  • Directional Bias: One of the principles in Dow theory states that a market will continue moving in a direction until something happens to affect the momentum.
  • Momentum: Markets change direction because of a decrease in momentum. A technical trader needs to know how to watch for changes here.

In this example, we are using the charts and a momentum indicator to time the exit of a trade. Because markets will maintain a trend until there is a change in momentum, we can watch for a shift in momentum to indicate that the market could reverse.
Investors will close the trade when they see this change, as they know, potential profits are maximized.

Both the technical and fundamental analysis have their limitations, which is the main reason why some professional traders choose to combine the two. If both technical and fundamental data suggest a profitable trade, the probabilities of success can increase considerably.

Some question the validity of technical analysis. The efficient market hypothesis claims that all past price information is already reflected in the current price. If this is the case, since all the data in the charts is old information, there is no exploitable data to beat the markets. And in this way, fundamental trading is the only way to speculate on future pricing accurately.

CONCLUSION
Every successful trader knows that it takes study, practice, and dedication to get to the point where you can achieve consistent monthly profits. Whichever way you choose to trade, you have to trade with knowledge and discipline.

You don’t have to worry about which one of the two approaches is better. Instead, take advantage of both of them to help make better-informed trading decisions and help you find more opportunities.

What is margin call in forex trading & ways to avoid it.

Getting a Margin Call is obviously a nightmare for any trader, and we know the problem.

So what is a margin call? Well, it is a broker’s demand to you as a client to bring margin deposits up to the initial margin level in order to keep holding current positions open. The margin call most frequently happens with a move to close your positions.

Technically, it is important to keep the value of the account higher than the maintenance margin level, otherwise your positions will simply be closed and this will result in a loss for you. Sometimes giving up on your trade and facing a loss is the right thing to do, but if your vision is different – you can avoid a margin call by adding more funds to your trading account.

So Here we are going to see :  What does Margin call mean? How to calculate Margin level? and How to avoid Margin call? So, let’s get started.

Your first job as a trader

Without a doubt, the first job as a trader is to protect your trading capital. If you get wiped out, there are no more trades to be had. This is what we use stop losses for, as it gets us out of the market when we are proven incorrect in our analysis. This is why keeping your margin under control is crucial, because you may not be wrong with your position longer term, but if you are too highly leveraged; you can be forced to leave the market before the trade has worked itself out.

By taking care of the margin, you give the trade “room to breathe”, and more importantly you give yourself a chance to be successful. You must keep in mind that the professional trader constantly worries about protecting their account. If you place intelligent trades and follow a statistically profitable system, the gains of course will come, over time.

What does “Margin Level” mean?

Margin level is a mathematical equation that effectively tells the trader how much of their funds are available for new trades. The Margin Level is the percentage (%) value based on the amount of Equity versus Free Margin. Margin Level allows you to know how much of your funds are available for new trades.

The higher the Margin Level, the more Free Margin you have available to trade.

The lower the Margin Level, the less Free Margin available to trade, which could result in something very bad…like a Margin Call or a Stop Out or Forced Closure from the brokers.

It is calculated with the following formula:

Margin level = equity/margin x 100%

If you don’t have any trades open, your margin level will be zero. Once a position is opened, the margin level will depend on several factors such as:

•  Volume

•  Leverage

How to Calculate Margin level

Let’s assume you have started your trading career with $1,000, which you have deposited in your newly created trading account.

You want to go long USD/JPY and want to open 1 mini lot (10,000 units) position. The Margin Requirement is 4%.

How much margin (Required Margin) will you need to open the position?

Required Margin = Notional Value x Margin Requirement

     $400 = $10,000 x .04


Assuming your trading account is denominated in USD, since the Margin Requirement is 4%, the Required Margin will be $400.

Since we just have a single position open, the Used Margin will be the same as Required Margin.

Let’s assume that the price has moved slightly in your favor with a profit of 10$ and your position is now trading $1,010.

This means that your Floating P/L is $10.

Let’s calculate the Equity:

     Equity = Account Balance + Floating Profits (or Losses)

      $1,010 = $1,000 + $10


The Equity in your account is now $1,010.

Equity = $1,010, Balance = $1,000, Floating P/L = $10

Now that we know the Equity, we can now calculate the Margin Level:

    Margin Level = (Equity / Used Margin) x 100%

           252.5% = ($1,010 / $400) x 100%


The Margin Level is 252.5%.

In the example, since your current Margin Level is 252.5%, which is way above 50%, you’ll still be able to open new trades. As long as the Margin Level is above 50%, then your account has the “green light” to continue to open new trades.

If the Margin Level is 100% or less, most trading platforms will not allow you to open new trades.

This is the reason why you must not take excessive leverage or utilize your full margin. Using excessive leverage and having a lower margin is the deadliest combination a trader may face.

 Margin call, Stop Out Level and Forced closure

If the equity in your account falls below 50% of your margin requirements, you will receive a margin call .The margin call is informing you that you have insufficient equity in your account and you should either close some of your positions, or top-up your account with appropriate funds. You can close, or partially close your positions from your MT4/MT5 terminal, or log into your client area and top up your account with a credit card, or one of our other instant funding options.

If you ignore the margin call warning and your equity continues to fall, the new “stop out” level begins – it’s at 30% stop out occurs. At this point, the trading terminal will close automatically as per the Broker setting. Automatically closing the open positions – a process called “stop out”. The stop out occurs when the existing positions are going against the traders, which means they are losing money and the available equity is slowly reducing. When the margin level gets to 30%, as per the broker setting the trading terminal will start closing the positions until the previous level is restored.

What are the best ways to avoid the Margin Call?

If we combine all the causes of the margin level & margin call together into a list, the main reason that leads to the margin call is the following: the use of excessive leverage with insufficient capital whilst holding onto losing trades for too long when they should have been cut. To tell the truth, proficient traders almost never experience margin calls. They manage their trades well enough and apply different steps. So let’s take a closer look at them.

1) First of all, monitor your account on daily basis. In addition, do not forget to use stop loss orders to reduce your risk exposure. Effective money management increases your chances to avoid the margin call.

2) You might also consider that one of the best ways to avoid margin calls is not to use leverage. As alternative, you can keep your use of margin at the low end of your borrowing limit. Hence you can limit the leverage to no more than 10-20%. Thereby, you will have some leverage to improve your performance in a risky market, yet enough to avoid triggering a margin call.

3) Another step you can take is to review your portfolio composition. If you diversify your portfolio across a broad range of shares or managed funds, you can potentially mitigate the risk of receiving a margin call in times of high volatility.

4) You should keep additional liquid resources at the ready if you need to add either money or securities to your margin account.

By following the above ways you can easily avoid the Margin calls.