Best time to trade Forex

Market participants often wonder – what is the best time to trade Forex to get the best results? Many first-time forex traders hit the market running. They watch various economic calendars and trade voraciously on every release of data, viewing the 24-hours-a-day, five-days-a-week foreign exchange market as a convenient way to trade all day long.

The forex market runs on the normal business hours of four different parts of the world and their respective time zones, which means trading lasts all day and night. So what’s the alternative to staying up all night long? If traders can gain an understanding of the market hours and set appropriate goals, they will have a much stronger chance of realizing profits within a workable schedule.

Although, it’s a matter of personal preferences when to trade – in the morning or in the evening – and it also depends on the trader and his daily schedule, let’s see when it’s best to enter the market to make higher profits and when you should avoid trading. In this article, we’ll try to give answers to these questions and figure out the best trading hours.

The Forex Markets Hours of Operation

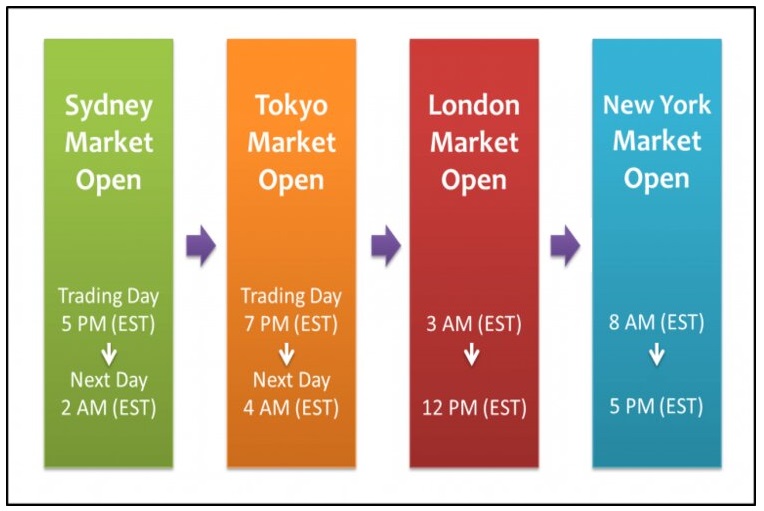
Forex is a network of international exchanges and brokers. Trading hours are determined when each participating country’s exchange is open. The first step in determining the best time to forex is to understand when each major market is open. Here is a brief overview of the four major markets (hours in Eastern Standard Time, or EST):

New York (open 8 a.m. to 5 p.m.) is the second-largest forex platform in the world, watched heavily by foreign investors because the U.S. dollar is involved in 90% of all trades. Movements in the New York Stock Exchange (NYSE) can have an immediate and powerful effect on the dollar. When companies merge, and acquisitions are finalized, the dollar can gain or lose value instantly.

Tokyo, Japan (open 7 p.m. to 4 a.m.) is the first Asian trading center to open, takes in the largest bulk of Asian trading, just ahead of Hong Kong and Singapore. The currency pairs that typically have a fair amount of action are USD/JPY (or U.S. dollar vs. Japanese yen), GBP/CHF (British pound vs. Swiss franc), and GBP/JPY (British pound vs. Japanese yen). The USD/JPY is an especially good pair to watch when the Tokyo market is the only one open, because of the heavy influence the Bank of Japan (Japan’s central bank) has over the market.

Sydney, Australia (open 5 p.m. to 2 a.m.) is where the trading day officially begins. While it is the smallest of the mega-markets, it sees a lot of initial action when the markets reopen on Sunday afternoon because individual traders and financial institutions are trying to regroup after the long pause since Friday afternoon.

London, Great Britain (open 3 a.m. to noon): The United Kingdom (U.K.) dominates the currency markets worldwide, and London is its main component. London, a central trading capital of the world, accounts for roughly 43% of global trading. The city also has a big impact on currency fluctuations because Britain’s central bank, the Bank of England, which sets interest rates and controls the monetary policy of the GBP, has its headquarters in London. Forex trends often originate in London as well, which is a great thing for technical traders to keep in mind. Technical trading involves analysis to identify opportunities using statistical trends, momentum, and price movement.

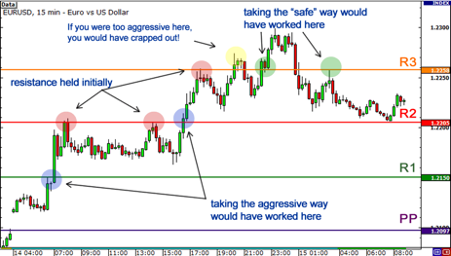
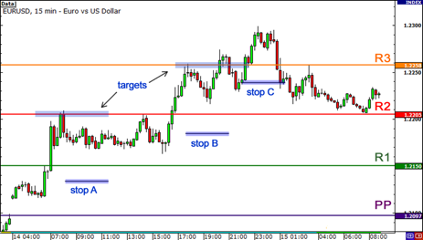
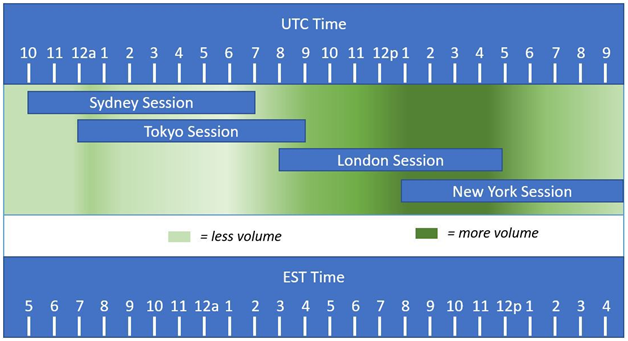
The least active times to trade are the quiet zones of the Sydney and Tokyo Sessions, which is a combined 10 hour stretch of time. Unless you are scalping during this session, hoping that your scalping system can take advantage of the lower liquidity, it is a good time to take a break and rest. The trading volume is very thin (relatively speaking) and few trends ever develop during this time. Most of the European traders have already gone to bed and the US traders have gone home to their families or have gone to bed themselves. If you are awake and have free time, it can be a good time to get prepared for the opening of the European session.

The whole year can be divided in thirds, starting with the three terrible months of Summer, the four best months of Autumn, and the four decent months of Winter-Spring.

  • The FOUR best months (Autumn): September, October, November, and December.
  • The FIVE good Months (Winter-Spring): January, February, March, April, and May
  • The THREE worst months (Summer): June, July, and particularly, August.

Markets move for two reasons, investor sentiment about the future and news that breaks during the present. News releases can shape how investors feel about the long-term prospect of any given currency and set scheduled entrance and exit points. News used for long-term investing is usually released at predetermined dates and times, planning for all outcomes possible. Some of the major news releases used in Forex trading include:

  • Retail sales figures
  • Non-farm payrolls
  • Unemployment rates
  • Consumer price indexes
  • Gross domestic product
  • Interest rate announcements
  • Consumer confidence indexes


These and other regular news releases can be useful to determine which currencies may be strengthened or weaken against another currency. Understanding how one or more economic indicators impact currency pairs can help fundamental traders. Where 24-hour trading becomes difficult is when sudden, unexpected news shakes the marketplace.

Conclusion

Traders looking to enhance profits should aim to trade during more volatile periods while monitoring the release of new economic data. This balance allows part-time and full-time traders to set a schedule that gives them peace of mind, knowing that opportunities are not slipping away when they take their eyes off the markets or need to get a few hours of sleep.

Paying attention to the time of day, week or month isn’t going to be a winning Forex trading strategy in itself, yet there have been statistical tendencies based around these timings which you can use to improve the edge of a good trading strategy. You might do this by risking a little more when trades set up at the “better” times and a little less at the “worse” times.

How to trade like a hedge fund manager

You might be shocked to hear this, but there aren’t many differences between you and a professional hedge fund manager. The only real differences are the balance of your trading account and your ability to control yourself.

Hedge fund managers oversee a specific hedge fund or a targeted portion of it. A hedge fund features a pool of investments managed with less regulation than more traditional investment vehicles. Fund managers capitalize on market opportunities, while consistently balancing high-risk investments with the rate of return. The high stress and the demanding hours of the job are reflected in a hedge fund manager salary, in which top earners bring in billions. Even though hedge funds manage billions of dollars, they use well-known trading strategies that aim to reduce their overall market risk while simultaneously boosting their trading performance.

We’ve summarized some of the most important techniques used by hedge funds to beat the market. Feel free to try them out and adopt those that match your trading style.

What are hedge funds and how do they trade ?

Hedge funds invest in a variety of financial markets using pooled funds collected from investors. They use numerous different trading strategies to boost their performance and the return for their investors. Usually, hedge funds are only accessible to high-net-worth individuals and professional investors, as they are less regulated than other types of funds such as mutual funds.  As long as the potential return on an investment exceeds the costs associated with the borrowed funds, trading on leverage can significantly increase a hedge fund’s return. Unfortunately, since leverage is a double-edged sword which also increases potential losses, many hedge funds have ceased business since the financial crisis of 2008.

Hedge funds often require investors to keep their money invested for a specific period of time, often at least one year or a minimum period of time. During this period investors aren’t able to withdraw their money. This is called the lock-up period. Even after that period, many hedge funds have certain withdrawal limitations in place which are designed to boost the liquidity of the fund, and withdrawals are often allowed only at certain intervals, such as bi-annually or quarterly.

It’s important to note that hedging refers to a technique of reducing market risk, but most hedge funds aim to outperform the market. The name hedge fund was coined with the first hedge fund in the 1940s which tried to hedge long equity positions with short equity positions also known as long-short strategy.

Defining the strategy

Hedge fund managers use different strategies to boost their revenues. As such, there are many strategies that have been developed. Some of them are strict technical traders who specialize on charting while others are fundamentalists who believe in using the news and market data. Others combine the two strategies. On the other hand, others use the hedging technique while others are long, short traders. Others are contrarian while others are activist investors. As a trader, you need to define the strategy to use and fall in love with it. Perhaps, your strategy can entail trading currencies from the emerging markets only. Alternatively, you can have the strategy of trading precious metals or crude oil. You also need to define the timeframe through which you will be trading. By having a specific strategy, you will be at a good position to understand the market and place trades that you are comfortable with.

When to enter and exit the trade

The time you enter or exit a trade will be very important for you. This is simply because if you enter a trade at the wrong time, you might end up losing. On the other hand, if you exit early, chances are that you might avoid an upside. There are 4 key strategies to enter and exit in trading.

  • Single entry, single exit. This is a strategy where you put your entire position at one price and then exit the entire position at a specific price.
  • Single entry, multiple exits. Here, you will make one entry and then position the trade to exit at multiple levels. This strategy is ideal for riding a breakout.
  • Multiple entries, single exit. In this strategy, you enter a trade at different times but exit once a certain level has been reached by averaging up or averaging down. Averaging down is to add a position if it moves against you while averaging up is to add a position that is going against you.
  • Multiple entries, multiple exits. This is a strategy where you scale into and out of positions where you make multiple entries and multiple exits especially in a trending session.


Psychology of Hedge fund manager.

All successful hedge fund managers have had their down years. In fact, many of them have in different years lost billions of dollars in their careers. The key to their success has always been to manage their losses in a credible manner. They understand that the market is made up of a series of bumps. As a trader, you need to be psychologically prepared for any eventuality. At times, you might do a comprehensive review of the market and place your trade accordingly but the market fails to respond in your favor. At this time, you might be forced to recoup your funds by placing trades in the opposite direction and make huge losses. Therefore, you should always learn to manage the risks of trade up and down market movements.

Your think should be the success of the game

The ability to change how you think about the money in your trading account is what you really need to succeed at this game.

What professional hedge fund traders know and do, is think about the accounts they trade as score boards, keeping score in a giant world-wide game. The score is the trading account balance and to them, it’s nothing more than digits on a screen, the more zeros they rack up after the first couple digits the better they are doing.

Imagine managing a billion dollar position the same as you would manage a $1,000 position? The only way to accomplish this is by remembering it’s all just zeros; it’s just digits on a screen. If you start allowing yourself to truly “feel” the power of the money, you have already lost.

The ONLY true weapon you have as a small retail trader, is not allowing yourself to be affected by the money you have at risk in your account. This can be accomplished a number of different ways:

  • Don’t trade with money you really can’t afford to lose.
  • Know your overall net-worth, liquid money left over after debt.
  • Risk a very small amount of your liquid money per trade.
  • I like to do the “sleep test”; if you are able to sleep with your position on, then you’re good.


If you are doing all of the above, then the final step to trading your account like a hedge fund manager lies in how you think about the money you’re trading.

Conclusion

As a trader, self-reflection is an important ingredient for success. All successful hedge fund managers take time to reflect on their daily, weekly, or monthly traders. We can tell you from our personal experience, that the only thing more potentially nerve-racking than trading your own real money, is trading someone else’s money. Thus, a hedge fund manager needs to have ‘ice in their veins’ (discipline, self-control), otherwise they are not going to get above average returns for their clients.

Pivot Point

Pivot points:

A pivot point is a technical analysis indicator, or calculations, used to determine the overall trend of the market over different time frames. The pivot point itself is simply the average of the high, low and closing prices from the previous trading day. On the subsequent day, trading above the pivot point is thought to indicate ongoing bullish sentiment, while trading below the pivot point indicates bearish sentiment.

The pivot point is the basis for the indicator, but it also includes other support and resistance levels that are projected based on the pivot point calculation. All these levels help traders see where the price could experience support or resistance. Similarly, if the price moves through these levels it lets the trader know the price is trending in that direction.

In many ways, forex pivot points are very similar to Fibonacci levels. Because so many people are looking at those levels, they almost become self-fulfilling.

The major difference between the two is that with Fibonacci, there is still some subjectivity involved in picking Swing Highs and Swing Lows.

Pivot points are especially useful to intraday traders who are looking to take advantage of small price movements.
Just like normal support and resistance levels, forex traders can choose to trade the bounce or the break of these levels.

Range-bound traders use pivot points to identify reversal points. They see pivot points as areas where they can place their buy or sell orders.

Breakout forex traders use pivot points to recognize key levels that need to be broken for a move to be classified as a real deal breakout.

Here is an example of pivot points plotted on a 1-hour EUR/USD chart

Here is an example of pivot points plotted on a 1-hour EUR/USD chart

Pivot Point Lingo: Here’s quick rundown on what those acronyms mean

  • PP stands for Pivot Point
  • S stands for Support
  • R stands for Resistance

But don’t get too caught up in thinking “S1 has to be support” or “R1 has to be resistance.

How to Calculate Pivot Points

The first thing you’re going to learn is how to calculate pivot point levels.

The pivot point and associated support and resistance levels are calculated by using the last trading session’s open, high, low, and close.

How to Calculate Pivot Points

These are basically mini levels between the main pivot point and support and resistance levels.

If you hated algebra, have no fear because you don’t have to perform these calculations yourself. This Indicator is available in Market.

How to use Pivot Points for Range Trading

The simplest way to use pivot point levels in your forex trading is to use them just like your regular support and resistance levels.

Just like good ole support and resistance, price will test the levels repeatedly.

The more frequently a currency pair touches a pivot level then reverses, the stronger the level is.

Actually, “pivoting” simply means reaching a support or resistance level and then reversing.
If you see that a pivot level is holding, this could give you some good trading opportunities.

  • If price is nearing the upper resistance level, you could SELL the pair and place a stop just above the resistance.
  • If price is nearing a support level, you could BUY and put your stop just below the level.
Let’s take a look at an example so you can visualize this. Here’s a 15-minute chart of GBP/USD.

In the chart above, you see that price is testing the S1 support level.

If you think it will hold, what you can do is buy at market and then put a stop loss order past the next support level.

If you’re conservative, you can set a wide stop just below S2. If price reaches past S2, chances are it won’t be coming back up, as both S1 and S2 could become resistance levels.

If you’re a little more aggressive and confident that support at S1 would hold, you can set your stop just below S1.

As for your take profit points, you could target PP or R1, which could also provide some sort of resistance. Let’s see what happened if you bought at market.

For example, if you see that a double bottom candlestick has formed over S1, or that the stochastic oscillator indicator is indicating oversold conditions, like that check some parameters for additional confirmation, then the odds are higher that S1 will hold as support.

Also, most of the time, trading normally takes place between the first support and resistance levels.

Occasionally, price will test the second levels and every once in a while, the third levels will be tested.

How to use Pivot Points to Trade Breakouts
Just like your normal support and resistance levels, pivot point levels won’t hold forever.

Using pivot points for range trading will work, but not all the time. During the times that these levels fail to hold, you should have some tools ready in your forex toolbox to take advantage of the situation!

As we showed you earlier, there are two main ways to trade breakouts: the aggressive way or the safe way. Either method will work just fine. Just always remember that if you take the safe way, which means waiting for a retest of support or resistance, you may miss out on the initial move.

Using Pivot Points to Trade Potential Breakouts

Let’s take a look at a chart to see potential breakout trades using pivot points. Below is a 15-minute chart of EUR/USD.

Here we see EUR/USD made a strong rally throughout the day.

We see that EUR/USD opened by gapping up above the pivot point. Price made a strong move up, before pausing slightly at R1. Eventually, resistance broke and the pair jumped up by 50 pips!

If you had taken the aggressive method, you would have caught the initial move and been celebrating like you just won the World Cup.

On the other hand, if you had taken the safe way and waited for a retest, you would have been one sad little trader. The price did not retest after breaking R1. In fact, the same thing happened for both R1 and R2

Notice how EUR/USD bulls tried to make a run for R3 as well.

However, if you had taken the aggressive method, you would have gotten caught up in a fake out as the price failed to sustain the initial break. If your stop was too tight, then you would have gotten stopped out.

Later on though, you’ll see that the price eventually broke through. Notice how there was also a retest of the broken resistance line.

Also, observe how when the pair reversed later in the day and broke down past R3. There was an opportunity to take a short on the retest of resistance-turned-support-turned resistance (read that again if you have to!).

“Role Reversal”

Remember that, when support levels break, they usually turn into resistance levels also applies to broken resistance levels which become support levels. These would have been good opportunities to take the “I think I’ll play it safe” method.

Where do you place stops and pick targets with breakouts?
One of the difficult things about taking breakout trades is picking a spot to place your stop.

Unlike range trading where you are looking for breaks of pivot point support and resistance levels, you are looking for strong fast moves.

If you were going long and price broke R1, you could place your stop just below R1.

Let’s go back to that EUR/USD chart to see where you could place your stops.

As for setting targets, you would typically aim for the next pivot point support or resistance level as your take profit point.

It’s very rare that price will break past all the pivot point levels unless a big economic event or surprise news comes out.

Let’s go back to that EUR/USD chart to see where you would put those stops and take profit.

If you believed that price would continue to rise, you could keep your position and move your stop manually to see if the move would continue. You’d have to watch carefully and adjust accordingly. You’ll learn more about this in later lessons.

As with any method or indicator, you have to be aware of the risks with taking breakout trades.

First of all, you have no idea whether or not the move will continue. You might enter thinking that price will continue to rise, but instead, you catch a top or bottom, which means that you’ve been faked out!

Second, you won’t be sure if it’s a true breakout or just wild moves caused by the release of important news. Spikes in volatility are a common occurrence during news events, so be sure to keep up with breaking news and be aware of what’s on the economic calendar for the day or week.

Lastly, just like in range trading, it would be best to pop on other key support and resistance levels. You might be thinking that R1 is breaking, but you failed to notice a strong resistance level just past R1. Price may break past R1, test the resistance and just fall back down.

After reading this, I hope you get the clear idea about pivot point calculation like how it works and how to use it.

Though this method is used by most traders some traders also use different types of pivot calculations. A few other types of pivot points are listed for your reference.

Note: Ideology of all pivot types is similar only the calculation method varies.

Pivot Points Types

  • Standard Pivot Point
  • Woodie Pivot Point
  • Camarilla Pivot Point
  • Fibonacci Pivot Point
  • Demark Pivot Point
  • Frank Pivot Point
  • Shadow Pivot Point
  • The Central Pivot Range

Which pivot point method is best?

As I already said standard pivot point calculation is used by most of the traders but it doesn’t mean it is the best, you can refer and analyse all types and find which one works better for your trading style.

However the truth is, just like all the variations of all the other indicators that you’ve learned so far, there is no single best method.

It really all depends on how you combine your knowledge of pivot points with all the other tools in your forex trading toolbox.

Just know that most charting software that do automatic calculations normally use the standard method in calculating for the pivot point levels.

But now that you know how to calculate for these levels on your own, you can give them all a swing and see which one works best for you.

Summary: Pivot Points

Here re some easy-to-memorize tips that will help you to make smart pivot point trading decisions:

Pivot points are a technique used by many traders to help determine potential support and resistance areas.

Pivot points can be used by range, breakout, and trend traders.

  • Range-bound traders will enter a buy order near identified levels of support and a sell order when the pair nears resistance.
  • Pivot points also allow breakout traders to identify key levels that need to be broken for a move to qualify as a strong momentum move.
  • Sentiment (or trend) traders use pivot points to help determine the bullishness or bearishness of a trading instrument.


The simplicity of pivot points definitely makes them a useful tool to add to your trading toolbox.

Front Running

Foreign currency trading appears to take place in a highly competitive environment. Since the mid-1990s, major currencies have traded almost continuously between large numbers of counter- parties on multiple electronic platforms in high volumes and with very tight bid-ask spreads. However, in recent years, government regulators and enforcement authorities across the globe undertook investigations into whether many of the world’s largest dealer-banks were acting anti-competitively in the Forex market.

Between 2014 and 2015 reports issued by the U.S. Department of Justice, the Commodity Futures Trading Commission, New York Department of Financial Services, the U.K. Financial Conduct Authority, and the Swiss Financial Market Supervisory Authority all concluded that dealer-banks engaged in a range of collusive conduct aimed at manipulating the Forex bench- marks. The investigators also found that the dealer-banks had engaged in other forms of anticompetitive conduct, including the collusive sharing of information and front-running.

Following these reports, the U.S Department of Justice and the Federal Reserve Board indicted and placed lifetime bans on more than a dozen individual FX dealers and in 2017 a dealer was convicted of wire fraud for his part in a scheme to front-run a $3.5 billion trade. In addition, multiple law-suites have been brought before the courts in the United States and Canada alleging that dealer-banks engaged in anti-competitive behavior that harmed investors. By the end of 2018, these investigations and law-suites produced fines and settlements totaling over $11 billion.

Front Running

Front running occurs when someone places a trade for themselves with prior knowledge of an incoming order. It‘s an illegal activity and also clearly places the firm’s interest ahead of the customer.

Front-running is also known as tailgating. Front-running is illegal and unethical because it takes advantage of private information that is not available to the public. If a big transaction is made public, then buy or selling ahead of it is not illegal. It also occurs when a broker or analyst buys or sells currencies for their account ahead of their firm’s buy or sell recommendation to clients.

Market Clearing Conditions of Forex Market

In particular, How the equilibrium behavior of prices and trading flows change when dealers share information about their customer orders, and when they front-run hedgers’ orders, both unilaterally and collusively. We describe trading between a large number of dealer-banks and two groups of customers called investors and hedgers. Trading takes place between dealers in the wholesale tier of the market, and between dealers and their customers in the retail tier. Dealers are risk-averse and choose their trades and price-quotes optimally in both tiers of the market. Investors are also risk averse and optimally determine the orders they place with dealers in the retail tier. In contrast, dealers receive orders from hedgers that are determined by an exogenous liquidity factor. We provides a rich environment to study  the market-wide effects of information-sharing and front-running.

There are three sets of market clearing conditions to consider:  those for investors’ orders, hedgers’ orders, and inter-dealer trading.  First, the dealer uses the advanced information about the hedgers’ Forex orders to “trade ahead” of those orders.  Dealers receive three types of information during the trading day: (i) public information on the Forex payoff in round i, (ii) market-wide information on prices and aggregate inter-dealer order flows, and (iii) private information on the Forex orders they receive from investors, hedgers, and other dealers.

 All other things remaining constant the dealer initiates Forex purchases (sales) in inter-dealer trading when he knows that he must fill hedgers Forex purchase (sales) orders in the future. Second, the incentive for dealers to front-run hedgers’ orders only arises here because dealers use to the information in those orders to better hedge against future shocks.

How does Front Running Work

Front-running is unethical and illegal as it gives an unfair advantage to the broker or trader. Front-running, much like insider trading, provides unfair advantages to the broker who has nonpublic information that will affect the asset’s price. It is also considered front-running if an analyst purchases or sell shares prior to their firm releasing a buy or sell recommendation. The trader knows the recommendation will impact the price of the asset in question, so placing a trade right before releasing the recommendation is unethical and illegal.

Firms and individuals are allowed to have positions in assets they recommend or discuss, but their position must be revealed at the time of the recommendation or discussion. Also, having a position isn’t illegal, but attempting to profit from non-public information is. A short-seller may accumulate a short position and then reveal their research to the general public on why they shorted the stock. This is not illegal, because the short-seller is trying to profit from overall conditions, and not simply trying to profit from releasing their information. The latter would be a short-sell version of the pump and dump.

Examples of Legal and Illegal Front-Running

Illegal front-running is primarily limited to two types. The first type is acting ahead of a non-public order, and the second is acting ahead of a piece of news that hasn’t been made public yet.

Assume a broker sees a market order come in to sell nearly 1000 Pips drops in a thinly traded Currency pair. Selling Currencies could decrease the price of the currencies in advance. The broker decides to sell in his own account first, and then execute the client’s order. As expected, the large order causes an instant price drop. The broker covers their short position and pockets a quick incentive from that.

In another example, assume that a firm is about to release a very negative report on a company. An analyst at the firm short-sells the currency pair in anticipation that the negative report will cause the price to drop. The report is released and the currency pair drops. The analyst covers their position and reaps a quick profit. This is illegal. Shorting after the news is released is not illegal since the information is now public.

The trader or broker doesn’t necessarily need to make money for the transaction to be considered illegal. Even if they lost money because the market did not react as expected, the activity is still illegal. Front-running another person’s or entity’s order is legal if the order is made public.

Impact Of Front Running

1. Risk-averse dealers have a strong incentive to unilaterally front-run their own customer orders, even when the execution of those orders has no impact on prices.

2. In an equilibrium where dealers have the opportunity to front-run their own customer orders, trading ahead of those orders creates an information externality that has significant effects on trading flows and prices. The externality slows down the process by which inter-dealer trading aggregates the information that is ultimately embedded into the prices, which in turn affects the trading decisions of both dealers and investors.

3. Front-running reduces the  costs dealers incur from providing liquidity to It raises the price hedgers pay when they are net purchasers of Forex, and reduces the price they receive they are net sellers of Forex. These effects are substantial. They reduce dealers’ costs of providing liquidity by more than 90 percent.

4. Front-running also affects the welfare of dealers and investors. The information externality makes risk-averse investors less willing to speculate on their private information when trading with dealers, so they make smaller trading profits when that information becomes embedded in future prices. This indirect effect of front-running can reduce investors’ expected returns by as much as 10 percent. The reduction in investors’ trading profits also benefits dealers, accounting for approximately half of the reduction in the total costs of providing liquidity across the market.

5. Collusive front-running has larger effects on aggregate inter-dealer order flows than unilateral front-running because information-sharing reduces the risks dealers face when trading ahead of customer orders. In other respects, the effects of collusive and unilateral front-running are quite similar. Greater collusion lowers the costs of providing liquidity to customers, and it reduces investors trading profits, but the effects are small.

Summary

Front-running is an unethical and illegal practice in which a broker with advance knowledge of a client’s large order for a currency or security earns a profit by placing orders for their own account in advance of the client’s larger order, at the expense of the client. It is worth emphasizing that these results address the impact of information-sharing and front- running across the entire market. It is also empirically important because even though dealer information-sharing and front-running appear to have been widespread, it is unlikely to have directly involved more than a small fraction of all trades in the market. In my analysis, dealers do not front-run investors’ trades or share information about those trades, so the impact of information-sharing and front-running on investors occurs indirectly via changes in the behavior of equilibrium prices. In this sense, the fall in investors’ returns represents collateral damage from dealer front-running.