Channel Pattern

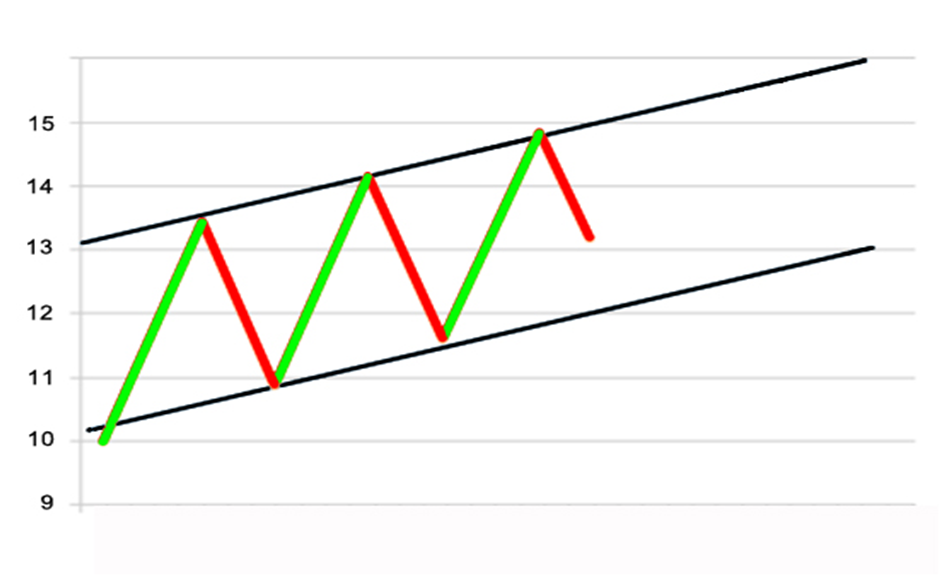
The Channel pattern chart borrows its name from the geometry of how rivers flow. A channel is formed when the energy of the river encounters a barrier (river bed). The river will hit this barrier and reverse in the opposite direction, hitting the barrier on the other side. This zigzag pattern of flow forms the bases of the channel pattern chart. This zigzag pattern of resistance and support movements occurs in Forex Market. It is the area between two parallel trendlines – upper trendline (resistance line), and, the lower trend line (support line). Channel can also be defined as the range in which the price of a security has traded for a specific amount of time.


2. Channel Pattern Formation

Channel Trend Line : It’s a line over pivot highs or under pivot lows to show the prevailing direction of price. It is parallel to each other. Upper trendline (resistance line) is drawn by connecting price highs, and, the lower trendline (support line) is drawn by connecting price lows.  Breakout of the upper trend line will indicate an opportunity to buy, while a breakout of the lower trend line will signal a strong selling opportunity. Channel can also be defined as the range in which the price of a security has traded for a specific amount of time.

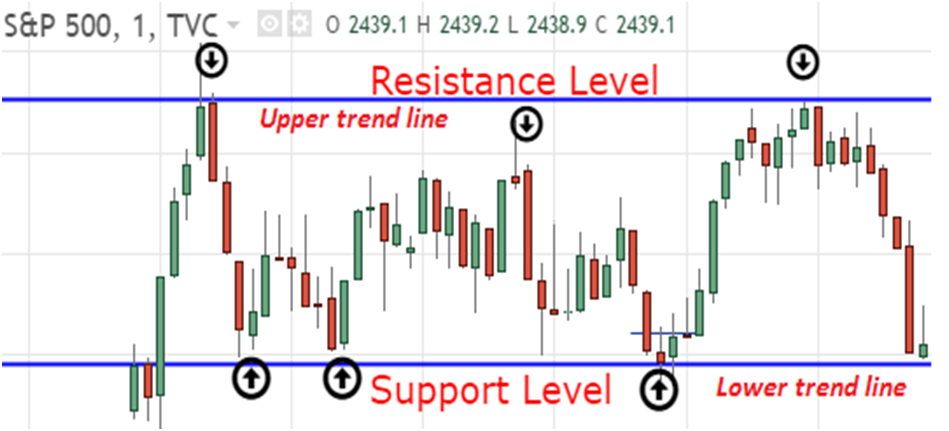
So for the channel example below, the 3 arrows located on the top(by the resistance level) are considered to be price highs. While the 3 arrows on the bottom(by the support level) are considered to be price lows. Price highs and lows refer to the price a security reaches before reversing and heading back in the other direction.

It is common that the support and resistance lines of a channel pattern chart will be tested alternately before the price breaks out. A new trend will form soon after the price has broken out of the channel chart. This newly formed trend may be short or medium term based on the volatility and movement of that current market. Channel trading is most effective for short-term trading

3.Types of Channels

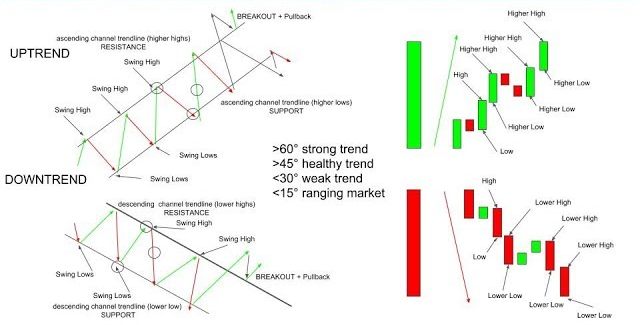
In accordance to the market trend, you can have an ascending channel (upchannel), a descending channel (downchannel), or a sideways channel (ranging channel).

Ascending channel

An ascending channel is an upward tipped trading range, which surrounds the price movement as the market forms higher highs and higher lows at the same place. You can see one illustrated on the screenshot below.

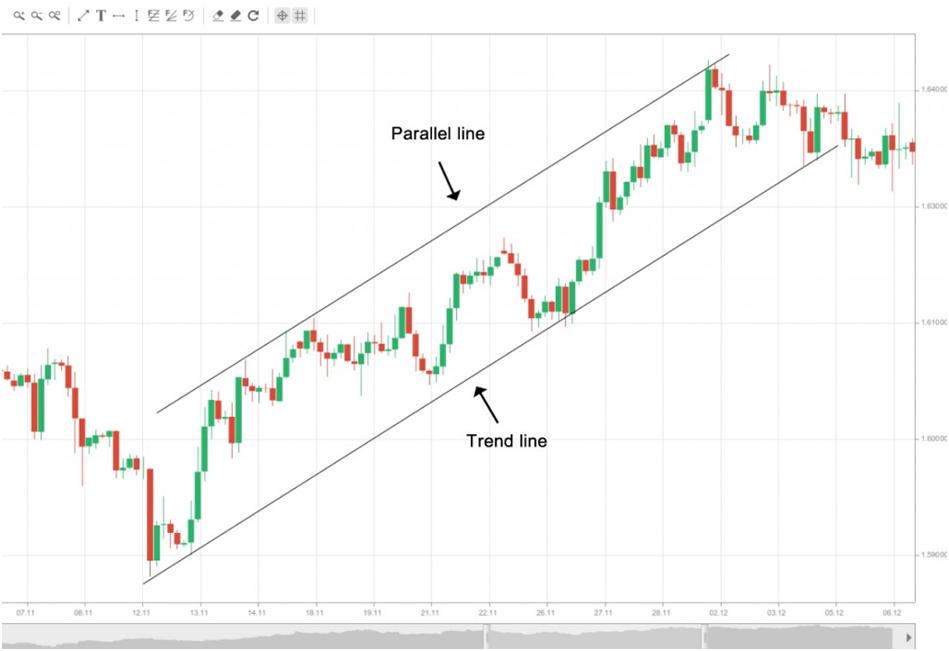
As you can see from the example, the market is forming new highs and new lows with an equal amount of price movement to the upside, which renders the lines going through them (the trend line and its clone) parallel.

In order to draw an ascending channel you need to do the following:

1. Draw a trend line as described earlier.
2. Draw another line tipped at the same angle and adjust its length in accordance to the projected channel.
3. Drag the concurrent line and place it, so that it runs through the most recent high.
4. If this is an actual ascending channel, then all the previous highs should lay on the cloned line, or deviate very slightly at most.
5. Do not attempt to forcefully make the second line become parallel to the trend line. If they are mismatching, then you simply dont have a channel.
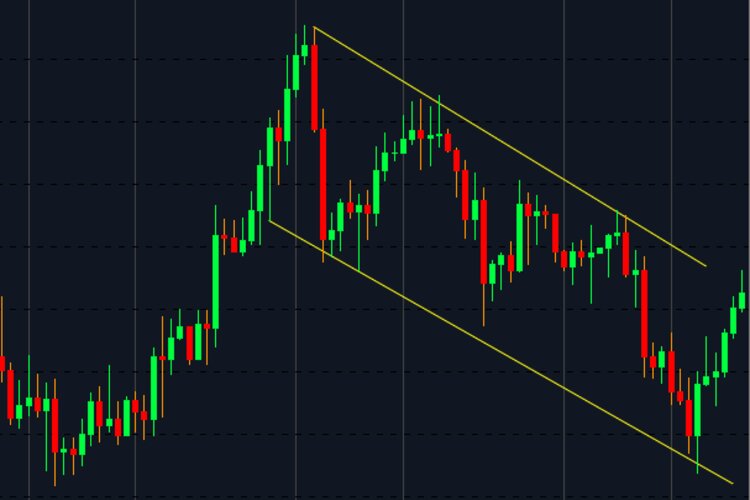
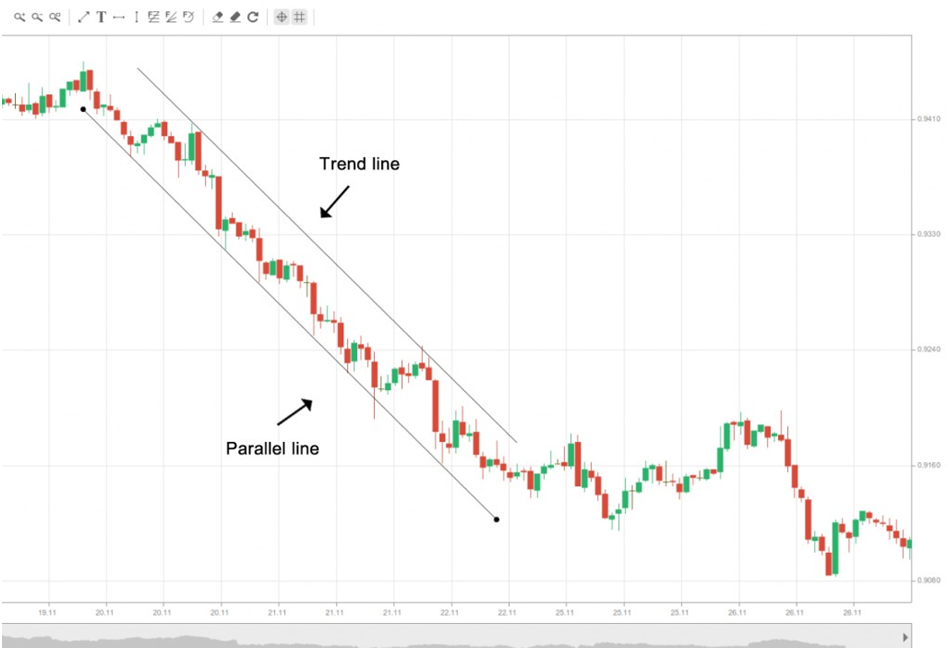
Descending channel

A descending channel is a downward tipped trading range, which surrounds the price movement as the market forms lower highs and lower lows at the same pace. You can see a down channel visualized below.

In order to draw a descending channel, you need to follow the same steps as when plotting an ascending one, just with the difference that the trend line lies above the price action, while the cloned line is below.

Ranging channel

A ranging channel, also known as a sideways or horizontal channel, is a trading range which has no difference in the angle between the nearest peaks and troughs. Basically the price is ranging within a horizontal support and resistance zone, as illustrated below.

In order to draw a horizontal channel, you need to follow the same steps as with the previous two types, but here you can choose with which side to start you can draw your trend line both below or above the price action.

4.How to draw a channel ?

More often this setup is termed as the trend channel trading strategy because it requires you to setup trendlines every time you want to find a channel.

Here are the steps that I use to form my channel:

1- Figure out a high, and, a low in the past. This will be the starting point of the channel.
2- Find another subsequent high, as well as, a subsequent low.
3- Connect the two highs to draw a line (Upper Trend Line). Connect the two lows to draw another line (Lower Trend Line).
4- If the two trend lines so obtained are near parallel, a channel is formed.

Thus, there are at least two contact points at the Upper Trendline, and, at least two contact points at the Lower Trendline.

Note:  More contact points increase the effectiveness, and, the reliability of the channel.

Channels can form on all time frames and can last as short as an hour, or last for months on end.

5. How to trade channels.

There are two ways in which to trade based on channel price movement. You can either trade the range, or you can trade the breakout, once it occurs.

Trading the range

Since the boundaries of any type of channel basically act as support and resistance. we can use the signals generated when the price meets those levels.

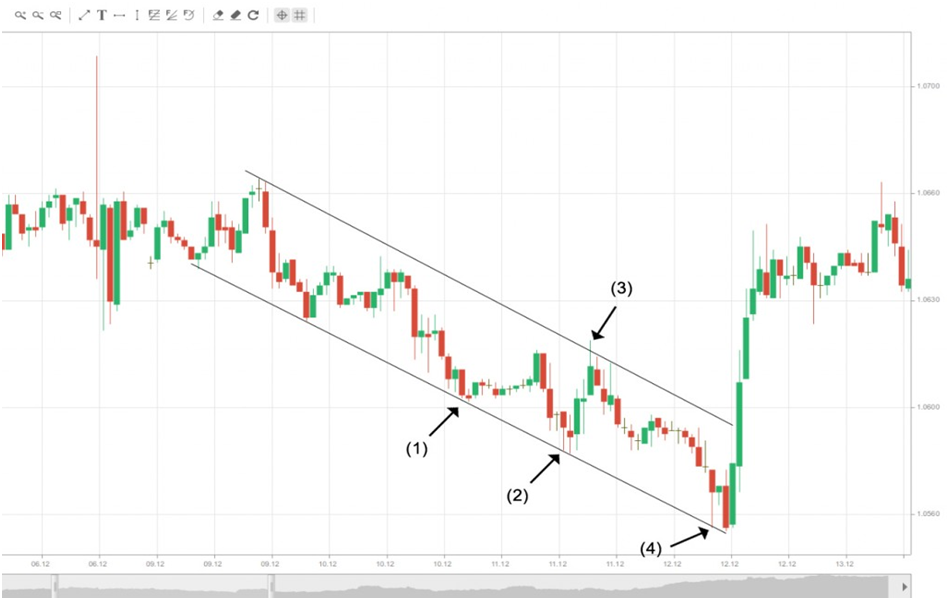
In the screenshot above you can see that (1) has generated a buy signal, and our upper boundary acts as a resistance, so this should be our profit target. At (2), we are provided with another buy signal, after which at (3) we exit our long position, thus securing profit, and we place a short order. As prices continue to decline through the channel, the market again touches the lower boundary at (4) where we exit our short position and enter a long one, guided by the generated buy-signal.

Trading the breakout

As you’ve already learned from the previous articles, breakouts produce very strong and broadly used trading signals, due to their high profitability. As with every other support or resistance level, prices can break through the upper or lower boundary of a channel, thus generating an entry signal.

On the example above you can see that price broke through the upper boundary, and after that continued to edge higher, thus providing a strong signal for a long entry. As we have already learned however, the possibility for a breakout to turn false always lurks around the corner, which is why it is best to wait for confirmation. It would be wise to wait for a candle to close outside the channel before placing an order, or in some cases, wait for a retest of the line.

A potential signal for an upcoming breakout out of the channel is an acceleration, which pushes the price above the upper boundary in an ascending channel or below the lower boundary in a descending channel. Most often this is due to pure emotionalism and is thus a potential sign of a price reversal. A trader, however, especially a beginner, must never bet against the current market conditions in anticipation for a price reversal, as a wrong move could be devastating. As noted above, it would be best to wait for the breakout confirmation and then enter a position with the comfort of trading with the new trend.

How to choose Expert Advisor

Forex robots (EA) have become very popular ever since the MetaTrader 4 trading platform was released. A forex robot or an expert advisor is a piece of computer software that automatically makes trading decisions on behalf of the trader. Forex robots are designed with inbuilt trading rules, which enable them to enter and exit trades without requiring the physical presence of a trader.

The most profitable robots are usually also the most risky ones. Before you invest your money, it is essential that you test the robot with a demo account and do backtests on historical market data. Choose an ECN forex broker that allows you to trade micro lots in order to start real trading with minimum risk and also to see if the EA works well with that broker.

Therefore, to avoid losing your hard-earned money, you need to make a good decision before buying an expert advisor for automated trading. This article will provide some essential tips for correctly choosing a forex robot.

How do Expert Advisor work ?

EAs work by enabling you to set the parameters by which opportunities are found, and positions are opened and closed – essentially using a set of yes/no rules to trigger trading decisions. You can either build an EA for yourself, or import one that someone else has built.

By combining lots of yes/no rules into a complex mathematical model, EAs can execute sophisticated trading strategies, using computational power to make decisions – and act on them – almost instantly.

Before using an expert advisor with a real trading account, you need to know in advance the financial risk that you can afford to take.

Analysing an Expert Advisor’s stats

1) The Profit Factor

The profit factor is one of the most important statistics. The profit factor is important because it shows the relationship between profit and risk. A robot that is profitable – but nevertheless risks all of the money in your account – is not an ideal robot.

To calculate the profit factor:

Profit Factor = gross profit (sum of all winning trades) / gross loss (sum of all losing trades)

If the profit factor is less than 1, you must eliminate it immediately, choose EAs with a big profit factor.

2) Expected profit per transaction

The expected profit (Expectancy) is a statistic that tells you how much you could earn on each trade on average. As much as they are based on past trading history, which doesn’t guarantee future results, it can still help choose the best and profitable forex robot.

Expectancy is the difference between the average profit per trade and the average loss per trade.

3) The different types of drawdown

A robot that makes money is no good if it takes too much risk on each trade. Drawdown is a very important indicator of risk. It shows the percentage of maximum loss recorded since the last high point. This can give you an idea of the potential drop in your account when the robot is in trouble.

The first step to analyze drawdown is to look at an equity curve chart. A rising curve indicates that the robot is profitable, but if the curve is rather agitated with frequent and large peaks and troughs, the robot is very volatile. A volatile robot will most likely have a high drawdown and pose a greater risk. You can therefore quickly filter the robots by selecting charts that display a smooth equity curve.

Maximum drawdown simply shows the maximum loss since the last high point. For example, a 50% drawdown means that at some point the robot lost 50% of the account value from its highest point. For example, if you opened a trading account with £10,000 and started to use this EA at the wrong time (just before the drawdown), you would have been subjected to a 50% loss of your capital from the start!

The average drawdown compares the EA’s various drawdown amounts. For example, let’s say that the expert advisor had 3 drawdowns, the first 10%, the second 4% and the third 12%. To calculate the average drawdown, you just need to add the three drawdowns and divide by three (10% + 4% + 12%) / 3 = 8.7%. The average drawdown is interesting to look at because it gives you an idea of what you can expect to lose during a drawdown period, while the maximum drawdown showed you the worst case.

Drawdown recovery is an indicator that measures the speed with which a trading system emerges from a period of drawdown (in time or in number of trades). As you can imagine, it is best to choose an EA that is able to quickly return to positive territory after a loss. However, a less volatile (and less risky) robot will recover from a drawdown in a slow and steady manner, unlike a riskier robot.

4) The risk-reward ratio

The risk-reward ratio indicates an Expert Advisor appetite for risk. An Expert Advisor that uses a 5-pip take profit and a 40-pip stop loss has a risk-reward ratio of 8:1. It therefore needs a success rate of at least 89% to be profitable.

Some EAs on the market – especially the ones that scalp – have a risk-reward ratio of 15:1 and higher, which indicates that it uses a very risky strategy. A high risk-reward ratio does not necessarily mean that the EA does not make money. An Expert Advisor with a 95% success rate will still be profitable with a 15:1 risk-reward ratio, but if that rate drops to 93%, the EA will lose.

Most EAs feature options that allow you to manage risk by adjusting the maximum SL and TP, which allows you to improve the risk-reward ratio. However, you need to make back tests before changing the settings to see if the changes do not affect the strategy.

Why are Expert Advisors popular ?

Expert Advsor3

Timesaving

A correctly-programmed EA can monitor hundreds of markets, meaning you don’t have to watch price movements 24 hours a day in order to find new opportunities.

Emotionless trading

Emotion can affect your bottom line. Automating your trading helps take the emotion out of your decision-making because an algorithm only views the markets in black and white.

Flexibility

Your EA can run on any market that you can trade using MT4, taking lots of information into account including price movements, economic announcements, technical indicators or even your current available balance.

Risks of Expert Advisors

Inexpert advisors

If the promise of a program that beats the returns of the world’s best fund managers at a fraction of the cost sounds too good to be true, then it probably is. So, if you’re planning on buying a readymade EA, it is imperative that you carry out your own research to make sure that what you are buying is worth the money.

Lack of human interaction

No matter how sophisticated your EA is, it’s no match for the human brain. As such, it is important to remember that while taking some of the emotion out of your decision making is often useful, removing it entirely can bring new problems. It is always important to keep track of how an EA is performing and assessing whether it is in line with your trading logic.

Not always online

Unlike a web trading platform, to run MT4 you have to install it. This means that you can only access it from the device you install it on, and your EAs can only run when that computer is switched on, with MT4 up and running and connected to the internet.If you want your EA to run round the clock, you’ll need a virtual private server (VPS).

Conclusion

Appropriately choosing a forex robot is critical to your success as a trader. If you do not invest your time and resources in making the best decision, you may fail to realize the benefits of trading forex using expert advisors. But while a well-coded, fully backtested and properly monitored EA can be hugely beneficial to your trading, there are some major pitfalls to avoid.

If you apply the tips outlined in this article, you will undoubtedly make a good choice and attain the objectives of your trading career.

Happy Trading !!

Trade and Risk Management

Trade Management:

Forex trade management is arguably the most important aspect of success in the markets; it can literally make or break you. Once you learn a high probability Forex trading strategy like price action, you have to know how to manage your trades after they are live. Most traders simply ignore this essential piece of the Forex trading puzzle. By ignoring trade management or by simply not being aware of it, it is only a matter of time before you self-destruct in the market. A perfect price action trade setup can very easily turn into a losing one if you fail to manage it properly

Forex Trade Management Mistakes

Most trade management mistakes are a result of emotional decisions. How often have you found yourself entering a new position just because your current position is in profit? Or how about moving stop losses further from your entry because you are “certain” that price will turn around and move back in your favour? Have you ever moved your profit target further out as a trade moved into profit because you convinced yourself it would keep going because of XYZ reason? Maybe you take profits smaller than 2 times risk all the time or often get stopped out at breakeven only to see the market move on in your favour without you? These are all very common errors that traders make which result from poor or no planning and emotional decision making.

All of these errors seem pretty silly when you’re not in the market and thinking objectively but, once you enter a trade, if you are not following a Forex trading plan and keeping track of your trades in a Forex trading journal, you are very likely to experience extreme temptation to make one or more of the above mentioned trade management mistakes. While trade management is not a concrete science or a mechanical process, there are some general guidelines you can chose follow and questions you can ask yourself before and during each trade which can help you manage your trades much more effectively

Averaging In and Averaging Out

Let’s discuss adding to positions and having multiple or partial positions. First off, the decision of whether or not to add to your initial position in a trade should largely be made before you enter. You need to analyse current market conditions and decide the most logical exit strategy and whether or not adding to your initial position is logical given current market conditions. If you are entering into a strong trending market, you may decide beforehand that you will try a trailing stop and try to let the trade run and add to it at logical levels as it moves in your favour. The safest way to add to a position as it moves in your favour is to average in as the market moves in your favour. Here is an explanation of averaging in

  • Averaging in means that you use your open profit to “pay for” the next trade, it allows you to add to your position in a risk-free manner, but the sacrifice is that you increase your odds of getting stopped out at breakeven. It typically is only good to try this technique in a market that is in an obviously strong up or down trend. Forget about it in trading ranges or sluggish / slow-grinding markets. Ideally you want to wait for a price action setup to form at a key level after the market has pulled back a bit, a good example of this would be if your initial position moved in your favour and then pulled back to around 50% of the way back to your entry and then formed a pin bar at a key level, or some other price action setup at a key level; this would be a logical spot to add to a position by averaging in. You want to avoid adding to a position just because you are in profit, ideally you want a price action-based reason to add to an already winning position.
  • Here is an example of averaging in: you sell the EURUSD at 1.4500 with one mini-lot. The position quickly goes into profit by 100 pips and then forms a fakey setup in the direction of your initial position. Once your first position is up 100 pips and the market formed another price action setup giving you a reason to take on another position, you add a second mini-lot with a 50 pip stop loss, you then move down the stop loss on the first lot to lock in +50 pips. Now, if the second position turns around and hits your 50 pips stop loss, the first position will also stop you out for a 50 pips profit, stopping you at breakeven.
  • This is a risk-free way to add to a position that is moving strongly in your favour. However, always keep in mind it increases your odds of getting stopped out at breakeven and making no money at all, the payoff is that you could obviously make twice as much (or more) money. One important note of caution is to make sure you never add to your initial position and double up your risk by not adjusting your stop on the first position. Averaging in means that you move your average entry price closer to the market price, if you double up your position and don’t trail up your stop loss, you open yourself up to substantial losses
  • Averaging out, also known as “scaling out” is often talked about in the Forex trading community but it is almost always a bad idea. The main reason it is a bad is because of this; when you scale out of a position all you are doing is reducing position size as the trade moves into your favour. Sound illogical? It is. Think about it for a minute. Why would you purposely want to hold the smallest part of your position at the most profitable part of your trade? It is always better to either take full profit at a logical spot in the market, 2R multiple or greater, or trail your stop on the full position, than to try and take partial profit by scaling out. The bottom line on averaging out is that holding the least profitable part of your position at the most profitable part of the trade is not a financially wise or logical way to try and maximize your winners.


Trailing Stops (Only use them when the market is trending)

Trailing your stop as a trade moves in your favour can be a very good Forex trade management technique. However, trailing has limitations and you don’t want to just blindly trail your stop.

  • Stop trailing techniques can take many different forms. A few of the more common ones including the following: trailing your stop up as a trade moves 1 times risk in your favour, thereby reducing your risk to 0 as a trade moves 1 times risk in your favour and subsequently locking in each 1R multiple of profit.
  • The 50% trail technique is also popular, in this technique you trail your stop to 50% of the distance between your entry and the newest high / low as the market moves in your favour; thereby locking in profit as the market moves in your direction, this technique generally gives a trade more room to breathe but it can also give way a lot of open profit if a trade comes back beyond the 50% level and stops you out.
  • Yet another popular trailing stop technique is to trail your stop just beyond the daily 8 or 21-day EMA. The 21-day EMA typically allows your trade to run for longer since it is less likely to get hit in a strong trending market than the 8-day EMA. The 8-day EMA trail would only be used in very quickly moving / trending markets. These are by no means the ONLY ways to trail your stop, they are just examples. There really is no right or wrong way to trail your stop loss, but just keep in mind it’s not the best strategy for every market condition. You generally only want to trail in strong trending markets.
  • Breakeven stops are not always a great idea because the market can whipsaw around as everyone knows; stopping you out at breakeven only to move back in your favour. What you need to realize about trailing stops to breakeven is that it can cut down your long-term gains by limiting your potential profits. Yes, you will eliminate some potential losses by moving to breakeven, but you will also eliminate some even larger rewards.


As traders, we all need to accept the risk that is an inherent part of any trade, and if you are entering the market on a sound price action trading strategy, you want to give your edge time to play out, essentially you are interfering with this edge if you move to breakeven as soon as possible. viewing my trades as a win or lose proposition and being totally OK with the loss, is a better way to trade long term, because you will inevitably have some winners that more than make up for your losers, and you don’t want to cut back on these winners through breakeven trades. There are times when moving to breakeven is a good idea; in very volatile markets or if you have pre-planned to trail up your stop in a logical manner like discussed above.

Getting the Most Out of Each Trade

The goal of any successful Forex trader is to get the most out of every trade they enter. The way that you give yourself the best chance to get the most out of every trade is by behaving in a logical and consistent manner and pre-planning all aspects of your Forex trade management.

There is a fine line between being a trader who lives in hope and being a trader who accepts the reality of the market by taking what the market offers them. Before you get into a trade you need to ask the question, “how far do I realistically think this market can move before a substantial correction occurs?” Once you master price action trading and learn to read the levels and dynamics in the market, you will be able to make a pretty accurate estimation of the potential of any setup before you enter. And keep in mind you are always less emotional before you enter a trade than at any time during it so, you have to assume that long-term, you are going to get the most out of every trade by managing it as much as you can before you enter it, rather than trying to manage it “on the fly”.

Listen to the signal and the market conditions; if there’s a price action setup at a clean breakout level or an obvious trend with strong momentum, trailing your stop into a 1 to 4 winner may have its reward. However, in a more congested or range-bound “not-so-sure” market situation, it’s not a good idea to pray and hope, trying to milk every last dollar out of a trade so you see, there is a certain amount of discretion involved in trade management, it’s most important to read the market conditions before you enter a trade and decide how best to manage the trade at that time while leaving open the possibility of adjusting your exit strategy if any obvious reversal signals occur in the course of the trade or if the market conditions change drastically. That being said, it’s almost always better to plan everything beforehand and then set and forget your Forex trades. Trading in this way allows you to see how your trading edge plays out over the long-term with no “outside” interference, and it prevents you from trying to force your will on the uncontrollable market. To learn more about Forex trade management.

3 Quick Tips to Managing Your Trades:

Something that is absolutely crucial for success, but often not discussed or understood correctly by many traders is just how important taking full profits are for staying in business and ensuring that the overall account risk reward stays in a good position.

Often have a trader or member show us a list of their winning trades that are solid A+ trades, followed by just one or two trades that have wiped out a chunk of their winnings.

This will then be followed up by them telling me how they are going to change something and they want thoughts or ideas.

Often they are looking to change something huge like a major part of their whole trading methodology are looking through their whole trading edge for where they are went wrong.

The problem is often not in the trades being entered.

The problem is simply that the profits when winning do not cover the losses when losing and a major reason for this can be because a trader is not taking enough 100% winning trades.

When we have a losing trade, it is always a 100% losing trade. What it means by this is that if we risk 3% of our account each trade, then we are going to lose 3% if we lose.

Often, we can take multiple profits off the table. We can also use break-even.If used wisely this can increase profits and also protect from bigger losses.

However, what happens if we take 50% profit at the first main profit target, we move our stop higher to a break-even position and we are then stopped out at break-even having only taken 50% profit on the winning trade?

See below for the chart example of this:

As the chart above shows; the trader takes 50% profit and moves their stop to break-even after price moves higher from the Bullish Engulfing Bar and then they are stopped out.

Now many, many times this management will stop the trader from taking on a full loss.

What we need to be careful and super mindful of is that we cannot pick individual situations out of a chart or trade an edge from one trade.

In the chart example above the trader ends up taking 50% profit at target 1 and then having the rest of their position (50%) stopped at break-even.

If the profit target 1 was 1/1 RR (Risk Reward), the total profit overall was 0.5 RR.

So, whatever was risked, if for example 3% was risked at the start, then 0.5 is the reward. That would look like 3% x 0.5 = 1.5%.

Over one trade this is not so bad and a trader can get away with it, after all adding 1.5% to your account looks okay.

However, if you turn right around the very next trade and make a loss, you will lose 3% and now be losing money.

This is where it hurts and that is why full profit trades are important for your overall account risk reward situation and they become more important the longer you trade.

Quick Example of Small Changes

Look at a small sample size of trades below, keeping in mind there is a winning edge over the market. This is a small five trade sample with three of these trades being winners and two losers.

NOTE: These numbers are for illustration purposes only to highlight risk rewards.

The longer the trader plays out this management, the longer they would lose money.

Starting amount: $100. Each profit in this example is 0.5 reward or 50% for simplicity.

Start: $100

Winner: $100 + 50% = $150

Loser $150 – $100 = $50

Winner: $50 + 50% = $75

Winner $75 + 50% = $112

Loser: $112 – $100 = $12

TOTAL = $12

Total Loss = $88 (started with $100)

Another five trades with a different order that also has a winning edge over the market with three winners and two losses, but ends in a losing outcome is below;

Start: $100

Winner: $100 + 50% = $150

Winner: $150 + 50% = $225

Loser: $225 – $100 = $125

Loser: $125 – $100 = $25

Winner: $25 + 50% = $37.5

TOTAL = $38

Total Loss = $62 (started with $100)

This applies to the strategies you use for entries and how you manage / exit your trades.

Do you often switch quickly after a few losses or if you think the grass over the other side of the pond could potentially be greener?

Do you know what really stands out massively from that last set of numbers? As highlighted below and also just discussed at length; when we lose, we get stopped for a 100%.

In our example scenarios above, what would happen if all you did is take full profit at the very first profit target instead of only 50% profit? That’s not much to ask right? We are not even shooting for bigger rewards.

There is a lot to factor in overall, but just say with these five trades, you just take profit at the first profit target at 1/1 RR. What then happens in the same scenario, how does it change?

Starting amount: $100. Each profit in this example is 1 reward or 100% for simplicity.

Start: $100

Winner: $100 + 100% = $200

Loser $200 – $100 = $100

Winner: $100 + 100% = $200

Winner $200 + 100% = $400

Loser: $400 – $100 = $300

TOTAL = $300

Total Profit = $200 (started with $100)

Start: $100

Winner: $100 + 100% = $200

Winner: $200 + 100% = $400

Loser: $400 – $100 = $300

Loser: $300 – $100 = $200

Winner: $200 + 100% = $400

TOTAL = $400

Total Profit = $300 (started with $100)

Small change, but huge difference with the same trades and method.

By not taking a different trigger for entry there can be a massive difference in either profit or loss.

Traders want to make money, but they get very nervous when they are not doing it straight away or think they are missing out.

We recommend using break-even in my trading. However a lot of traders do not use it correctly.

Instead of using it as a ‘free trade’ where a stop can be moved to let a trade continue to run, or to look for further profits where there is a potential for higher rewards, many traders use it as a psychological tool to shelter from losses.

This might happen regularly when it is placed too frequently, in the wrong market types and too close to the price.

Often traders have not practiced the strategy they are using to manage their trades and are instead in the live markets ‘hoping’ their management strategies will work.

On too many occasions to count we have seen traders get stopped at break-even and be really frustrated. The very next trade because they are frustrated, what do they do? They scrap their plan.

They throw out the plan they have built and known and instead of moving to break-even and taking profits where they normally do, they let their profits ride.

They do this because they are annoyed. The markets annoyed them. Like it is the market’s fault. As if the market was out to get them.

What Type of Trader are You?

Do you like bigger winners or a steadier account rise?

You need to know your trading flavour and you need to back-test, forward test and perfect it.

It is so important you do not go anywhere near a live account until you are 100% confident and you know your method thoroughly.

If you are getting stopped at break-even and you have 100% confidence and faith in your trade management method, then you will continue to pull the trigger on trades and will continue to manage your trades in a business-like manner.

However if you have real doubts and concerns, the next time you get stopped at break-even, all of a sudden you will question your method. You will ask whether you should be trading differently, if what you are doing works, if you should have entered a different trigger and on it goes.

Both the high reward and also high win rate are solid and logical methods of managing your trading money with positives and negatives.

The question you need to ask yourself when thinking about either trade management methods is;

  • Do you want bigger winners with the downside being a far higher chance of more losing trades? Or,
  • Do you want a potentially steadier rising equity curve from regular, but from smaller winners?

So which method is better between the two and what money management method are you going to be better off using in your own trading?

To answer that question, we need to flip the question back over to you and ask you; what sort of personality do you have and what are you more comfortable with?

Don’t know what sort of trader you are or what flavour is for you? That’s okay. That exactly what you will come to work out as you start to make and also manage more and more trades.

You Need to Practice the Hell Out of it!

 The more trades you manage, the more of an understanding you will begin to get of your own trading personality.

It is absolutely amazing how trading has the ability to teach us things about ourselves and our personalities that we didn’t know existed because we are put into positions of stress, fear, greed and other emotional states that we would never be put into otherwise.

It is under these emotional extremes from the market that we really learn about ourselves and how we behave.

We learn what we like, we learn what we are prone to do when put under pressure and we especially learn what we will do when we are forced to act.

It is through all of these experiences we begin to really understand and workout our own trading personalities. Just as some like certain shades of blue and green, you may like the colour red or purple because we see things differently and we behave slightly differently given the same scenario.

This is a good thing. To manage your trades for profits consistently over the long-term, you need to begin understanding your trading personality and your ‘flavour’.

You need to work with it, because if you are always looking to fight it, it will just become another thing you are trying to depress and work against, rather than use to your advantage.

The decision on the method you use to manage your trades is going to have a very large bearing on your trade’s outcome.

Lastly – You Can Change Methods or Flavours

Note: Remember that the type of trader you are is not fixed and set in stone.

It also denotes if you are a high reward trader it does not mean that you are cannot grow on to make a change to becoming a high win rate trader.

However, remember this you cannot just flip from one trade management method to the next.

This will cause massive consequences within your trading.

If on one trade you were using one system as your edge and you decided that it was not working, so you stopped using it and then the very next trade you started using another system, that would cause massive differences and consequences.

Chopping and changing with your trade management will do the same.

You need to make sure that if you change your trade management method you go back to basics, practice it and give it time to work within the new plan.

Risk Management:

This is a process that takes time, dedication, commitment, and patience, if you want to be successful and profitable in the Forex market in the long run.

You can’t just open a position in your trading platform without taking into account the trading conditions set by your broker, the currency risk, and the trading risk that can affect your invested capital.

You also need to apply tools and techniques to manage your money and risks – if you don’t do those things, you wouldn’t be trading – you’d be gambling.

Check out these forex management tips:

It might sound obvious, but the first rule in currency trading, or any other kind of trading for that matter, is to only risk the money you can afford to lose. Many traders, especially beginners, skip this rule because they assume that it “won’t happen to them”.

If trading were like gambling at a casino, you wouldn’t take all the money you have to the casino to bet on black, right? Well, it’s the same with trading – don’t take unnecessary risks by using money you need to live.

Because it’s possible to lose all your trading capital, and secondly, because trading with funds you live on will add extra pressure and emotional stress to your trading, compromising your decision-making abilities and increasing the chances of making mistakes.

The Foreign Exchange market is a very volatile and unpredictable market, so it’s better to trade “conservative amounts” from your disposable income.

Before you start trading, you need to determine your risk tolerance, depending on:

  • Your age
  • Your knowledge of FX trading
  • Your experience
  • How much you’re willing to lose
  • And your investment goals


Knowing your risk tolerance is not just about helping you sleep better at night, or stress less about currency fluctuations.

It’s about knowing you are in control of the situation, because you’re investing the right amount of money vis-à-vis your personal financial situation in relation to your financial objectives.

Keep your investing within your risk tolerance and you decrease the likelihood of trading ruin.

Knowing about risk/reward ratio (RRR) will definitely improve your chances of becoming profitable in the long run, setting limit orders (stop-loss and take-profit) that protect your capital.

A RRR measures and compares the distance between your entry point and your stop-loss and take-profit orders.

For example:

Let’s say that you’re investing on the EUR/USD.

If the distance between your entry level and your stop-loss is 50 pips, and the distance between your entry point and your take-profit is 150 pips, then you would be using a RRR of 1:3, because you’re risking 50 pips to earn 150 pips (150/50 = 3).

The risk/reward ratio is a necessary tool to set your stop-loss and take-profit orders depending on your risk tolerance, and every wise trader should control the downside risk.

Even though determining a RRR depends on each trader’s risk tolerance, it’s common to use a risk/reward ratio of 1:3, where you expect to earn 3 times what you’re willing to lose.

When thinking about risks, you also need to consider your trading capital.

You should only invest a small portion of your trading capital per trade: a good starting point would be to not invest more than 2% of your available capital per trade.

If you have $10,000 in your Forex trading account, the maximum loss allowable would be $200 per trade.

Determining the risk per trade is a helpful tool if you go through a losing streak, so then you can better protect your trading capital, and avoid large drawdowns in your trading account.

The importance of position sizing

The secret of limiting losses lies in the triad Position sizing – Leverage – Stop Loss. Position sizing is a technique that determines how many units you should trade to achieve the desired level of risk.

It’s very important to choose your position size wisely. Here’s the golden rule of experienced traders:

Risk no more than 1-2% of deposit for 1 trade.

Have a look at the table below. It shows 2 traders with the same initial amount of money $20,000. The difference is that the first one risks 2% of his account on each trade, while the second one risks 10% of his account on each trade. If each trader has 10 losing trades in a row, the first one will have $16,675 left, while the second will remain with only $7,748.

Risk Management and Position Sizing are two sides of the same coin. You can’t apply risk management without proper position sizing.

How to calculate position size in forex 

  • You have a $10,000USD trading account and you’re risking 1% on each trade
  • You want to short GBP/USD at 1.2700 because it’s a Resistance area
  • You have a stop loss of 200pips

“How many units do you short so you only risk 1% of your trading account?”

Forex risk management – position size formula

Here’s the formula:

Position size = Amount you’re risking / (stop loss * value per pip)

  • The amount you’re risking = 1% of $10,000 = $100
  • Value per pip for 1 standard lot = $10USD/pip
  • Stop loss = 200pips


Plug and play the numbers into the formula and you get:

Position size = 100 / (200*10)

= 0.05 lot (or 5 micro lots)

This means you can trade 5 micro lots on GBP/USD with a stop loss of 200 pips; the maximum loss on this trade is $100 (which is 1% of your trading account).

How to calculate position size in stock trading

Once you understand how position sizing works, you can apply it across all markets. This means you can manage your risk like a pro no matter what instruments you’re trading.

Here’s an example for stock:

  • You have a $50,000USD trading account and you’re risking 1% on each trade.
  • You want to long Mcdonalds at 118.5 because it’s an area of Support
  • You have a stop loss of 250 ticks (which is $2.5)


How many shares of Mcdonalds do you buy so you risk only 1% of your trading account?

 Stock risk management – position size formula

Here’s the formula:

Position size = Amount you’re risking / (stop loss * value per tick)

  • The amount you’re risking is 1% of $50,000 = $500
  • Value per tick for 1 share = $0.01
  • Stop loss = 250 ticks

Insert these numbers into the formula and you get:

Position size = 500 / (250*0.01)= 200 shares

This means you can trade 200 shares of Mcdonalds with a stop loss of 250 ticks. If it’s triggered, the loss on this trade is $500 (which is 1% of your trading account).

The secret to finding low risk and high reward trades

The larger the size of your stop loss, the smaller your position size.

  • Assume you’re risking $1000 on each trade
  • Value per pip for 1 standard lot is $10USD/pip
  • Your stop loss is 500 pips on EUR/USD


Position size = 1000 / (500 * 10)

= 0.2 lot (or 2 mini lots)

For this trade, if the market moves 500 pips in your favour, you’ll gain $1000.

But what if you can reduce your stop loss to 200 pips?

Position size = 1000 / (200 * 10)

= 0.5 lot (or 5 mini lots)

For this trade, if the market moves 500 pips in your favour, you’ll gain $2500.

The bottom line is this tighter stop loss allows you to put on a larger position size for the same level of risk.

Most beginners will increase the size of their positions as soon as they’re making profits, which is one of the best ways to get your account wiped out. Keep your risk consistent.

Just because you’ve made a few winning trades doesn’t mean that the next one is going to be profitable.

Do not become over-confident and less risk-averse, as that will lead to you changing your money and risk management rules without solid reasons.

When you worked on your trading plan, you had to set up rules to decide about an effective size for your positions. This is just one step in establishing a successful trading method, now you need to stick to and follow your investment plan.

The Forex market is a leveraged market, because of its high liquidity.

Leverage means that you can invest more money than your initial deposit, thanks to margin trading. Your broker will only ask you to put aside a small portion of the total value of the position you want to open as collateral.

When using leverage, your profits can be magnified quickly, but remember that the same applies to your losses. This is why you need to understand how leverage and margin trading work, as well as how they impact your overall performance and trading.

Forex traders are often tempted to use high leverage to make significant profits, but if you’re over-leveraged one quick change in the market could easily wipe you out.

Because currencies are priced in pairs, it’s important to understand that currencies are linked to each other, or correlated.

Knowing about Forex correlations will help you better control your Forex portfolio’s exposure by reducing the overall risks.

Correlation represents a measure of how one asset evolves in relation to another.

If two assets are positively correlated, it means that they tend to evolve in the same direction, while if they are negatively correlated, they will evolve in opposite directions.

To use FX correlations to your advantage, you need to remember a few things:

  • Avoid opening several positions that cancel out each other For instance, if you go long on the EUR/USD and the USD/CHF, you can expect both currency pairs to evolve in opposite directions, which is almost like having no trading position in your account.


Why?

Because the USD is used once as a base currency (USD/CHF), and once as the quote currency (EUR/USD), which means that if the USD strengthens against its major counterparts, then the EUR/USD will go down, while the USD/CHD will go up – the evolution of one exchange rate cancelling out the other one.


  • Avoid opening positions with the same base currency, or quote currency

For instance, if you go long on the EUR/USD, the AUD/USD, and the GBP/USD, you can expect these currency pairs to be positively correlated because they all have the same quote currency, the USD.

It means that when the USD strengthens/weakens, your portfolio will go up/down.

  • Be aware of commodity currencies

Commodity currencies represent currencies that move in accordance with commodity prices, because the countries they represent are heavily-dependant on the export of these commodities.

As a general rule, if the price of commodities strengthen, then the currencies of the commodity producers will go up and vice-versa.

The main correlations to know about are the Canadian Dollar (CAD) and oil, the Australian Dollar (AUD) and gold/iron core, as well as the New-Zealand Dollar (NZD) and wool and dairy products.

To improve your Forex trading performance, you should understand your exposure of some currency pairs move together, while others evolve in opposite directions. The key is to diversify your portfolio to mitigate risks.

Before using a live trading account, try to back-test your trading plan on a demo account, and improve your strategy if needed.

Hope now you have a better idea about trade and risk management.

What Moves FX Markets

Forex is a real global marketplace, with buyers and sellers from all corners of the globe participating in trillions of dollars of trades each day. The forex market is made up of currencies from all over the world, which can make exchange rate predictions difficult as there are many factors that could contribute to price movements.

When opening a trading terminal, it is difficult to understand what exactly makes the price move in this or that direction. These factors influence a trader’s decisions and ultimately determine the value of a currency at any given point in time. To perform the fundamental analysis correctly, one should know the aspects that affect the price movement on the currency market and take them into account when deciding which position to open and in what direction.

1.Supply and Demand

Like most financial markets, forex is primarily driven by the forces of supply and demand, and it is important to gain an understanding of the influences that drives price fluctuations here. Currencies’ prices change primarily driven by supply and demand. Supply is the amount of a distinct product or item a seller wants to sell at a particular price. While demand is an amount of a distinct product or item a buyer wants to buy at a particular price. And so the price is going to move with changes in the supply and/or demand. There always has to be a seller and there always has to be a buyer for this to work.

However much the consumers wish to buy vs. the quantity of the item a producer wishes to sell is what makes supply and demand work. If the supply is larger than the demand, the price drops, and if the opposite happens, it goes up. We cannot determine if the imbalance of the supply-demand forces is due to hedging, speculation, or monetary conversion.

2.Central Bank Interest Rates

On a macro level, there is no larger influence in exchange rate values than central banks and the interest-rate decisions they make. In a general sense, if a central bank is raising interest rates, that means that their economy is growing and they are optimistic about the future; if they are cutting interest rates that means their economy is falling on hard times and they are skeptical of the future. This type of visualization may be overly simplified, but it usually is the way central banks respond to changes in their economies.

The complication comes in when traders try to anticipate what the central banks are going to be doing with rates. If traders expect an interest rate hike, they typically begin buying that currency well before the central bank is scheduled to make the decision, and vice versa if they expect the central bank to cut rates. However, if said central bank fails to do as traders expected, the reaction can be quite violent as traders exit their preconceived positions.

3.Capital Markets

The global capital markets are perhaps the most visible indicators of an economy’s health. It is easy to notice the release of public information in capital markets. There is a steady flow of media coverage and up-to-the-second information on the dealings of corporations, institutions, and government entities. A rally or sell-off of securities originating from one country or another should be a clear signal that the future outlook for that economy has changed.

Similarly, many economies are sector-driven, such as Canada’s commodity-based market. The Canadian dollar is heavily correlated with commodities, such as crude oil and metals. A rally in oil prices would likely lead to the appreciation of the Canadian dollar relative to other currencies. Commodity traders, like forex traders, rely heavily on economic data for their trades. In many cases, the same data will have a direct impact on both markets. Trading currency and commodity correlation is a fascinating topic.

The bond markets are similarly critical to what is happening in the forex market since both fixed-income securities and currencies rely heavily on interest rates. Treasury price fluctuations are a factor in the movements of exchange rates, which means that a change in yields will directly affect currency values. Therefore, it is essential to understand bonds an especially government bonds, to excel as a forex trader.

4.Fear and Greed

Momentum can be – and often is – accelerated by human emotion. In other words, when the market pushes on a door and it opens, it keeps pushing. The emotions that drive these moves are fear and greed, which in some senses are actually two sorts of fear – the fear of loss and the fear of missing out. In their simplest forms, fear can turn a falling instrument into an all-out panic and greed can turn a rising market into a blind-buying spree.

The sharp fall in the value of the Turkish lira seen in the summer of 2018 is the perfect example of this trait. The lira had been moving lower all year, but that downside gained extra impetus in August as the central bank failed to raise interest rates as anticipated, and the US unexpectedly imposed trade sanctions on Turkey over the detention of American clergymen. The markets sensed blood and kept selling the Lira. As a result, the lira fell by -26.36% versus the US dollar in a single trading week, taking its YTD losses versus the greenback at that time to just under -70%.

The best way to get to grips with these factors is to experience them for yourself and to do that you need to be watching the markets over key announcements and interest rate decisions, or staying ahead by watching the news flow and social media

5.News

Some news is planned and some isn’t, but both can move the market in very extreme ways. News that is scheduled is fawned over by many investors and can move markets on a regimented basis. As for the unexpected events, there’s not much we can do about them; you simply manage risk and hope you don’t get negatively affected.

Not all scheduled news events are market movers. Part of your job as a trader is to recognize when the major market-movers are happening in addition to how to navigate them. For instance, as a general rule, employment reports from the major financial centers tend to move markets more than a manufacturing sales report, and a retail sales figure riles things up more than a monetary supply report.

The Economic Calendar is a great resource to help you determine which reports provide the most punch. While not all important news events like a Non-Farm Payroll release or a central bank monetary policy decision move the needle when their number is called, they have the highest probability of doing so, and knowing when the markets will move can be one of the greatest advantages you have as a trader.

Conclusion

If you are a novice trader and do not have the necessary experience and skills, then before you start trading with real money, you need to learn how to correctly perform fundamental analysis based on the factors that influence Forex market movement described above, otherwise, it will just guessing or even gambling. Just remember that your end of day profits will depend hugely on time you spend doing the homework and paying enough attention to the preparation.