XAU/USD Weekly Forecast (17th January 2022 – 21st January 2022)

Fundamental view:

Gold showed an uptrend against the greenback during the trading course of the week. In this week, monthly report published by the US Bureau of Labor Statistics showed that the Consumer Price Index (CPI) rose to 7% on a yearly basis in December, which is the major catalyst for the fall of the US dollar. During this week, Powell said that they would need up to   policy meetings to come up with a plan in order to start reducing the balance sheet. His words lead the US dollar to earse its gains as it was recorded after the December minutes showed that some policymakers saw it appropriate to begin the balance sheet runoff following the first rate hike. He also said that “they could look to shrink the balance sheet maybe later this year.”

Elsewhere, The US Census Bureau reported that Retail Sales in December declined by 1.9% to $626.8 billion. This figure also pressured the US dollar in turn favoring the Yellow metal.              

The major economic events deciding the movement of the pair in the next week are TIC Net Long-Term Transactions at Jan 18, Building Permits at Jan 19, Initial Jobless Claims, EIA Crude Oil Stocks Change at Jan 20 and Baker Hughes US Oil Rig Count at Jan 21 for US.

XAU/USD Weekly outlook:

Technical View:

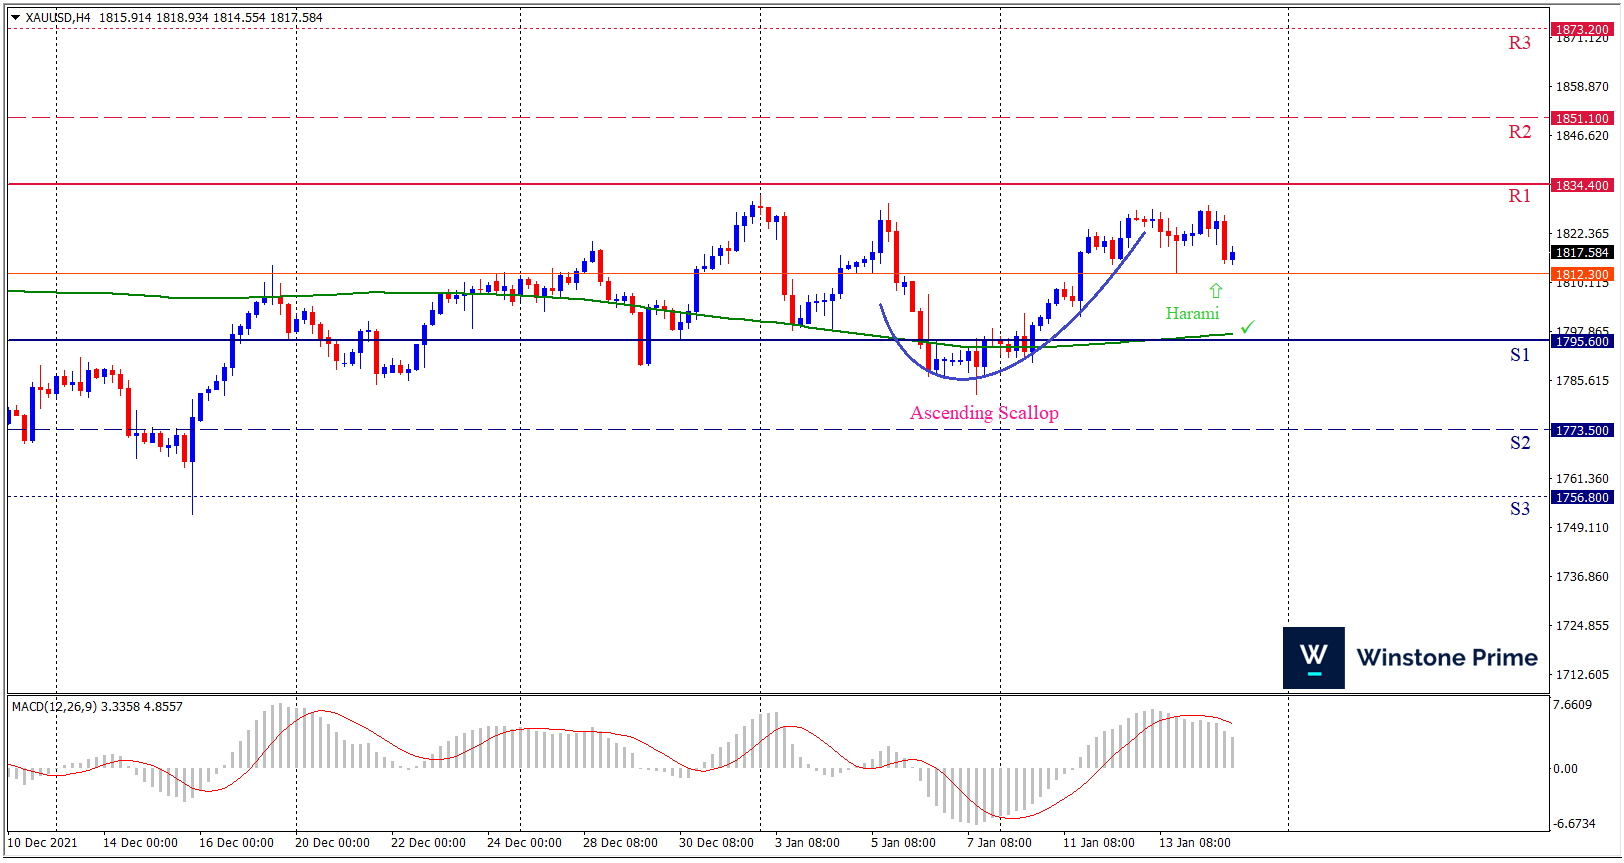
Last week’s high was 0.14% lower than the previous week. Maintaining high at 1829.1 and low at 1790.3 showed a movement of 388 pips.

In the upcoming week we expect XAU/USD to show a bullish trend. The Instrument is trading above the 200 Simple Moving Average and the MACD trades to the upside. A solid breakout above 1834.4 may open a clean path towards 1851.1 and may take a way up to 1873.2. Should 1795.6 prove to be unreliable support, the XAUUSD may sink downwards 1773.5 and 1756.8 respectively. In H4 chart ascending scallop pattern favors prospects of a bullish trend. Also to be noted Bullish harami formation exerts the expectation of uptrend for the pair.

Preference
Buy: 1817.5 target at 1853.7 and stop loss at 1790.4


Alternate Scenario
Sell: 1790.4 target at 1757.8 and stop loss at 1817.5

AUD/USD Weekly Forecast (17th January 2022 – 21st January 2022)

Fundamental view:

Like every other rival, Australian dollar also had a good time against the US dollar during this week. The quote reached 0.7313, a fresh two-month high. The American dollar fell after the country confirmed the December  Consumer Price index came out at a four-decade high of 7% YoY. Moreover, the country released December Retail Sales that was much worse than anticipated, falling by 1.9% MoM. Elsewhere, The core reading, Retail Sales Control Group, declined to -3.1%. Amidst all the catalysts, the dollar was under pressure. On the other hand, Inflation in Australia dropped to 2.8% year on year in December from 3.1% year on year, while retail sales rose to 7.3% year on year in November, beating the expected 3.9%. The upbeat Australian data favored the Aussie.

In this week, Fed Chair Powell Testimony on 11th January and CFTC AUD Non-Commercial Net Positions on 14th January favored downtrend whereas Australia Retail Sales monthly report on 11th January, US CPI monthly report on 12th January and Australia Home Loans monthly report on 14th January favored uptrend.

The major economic events deciding the movement of the pair in the next week are Australia Westpac-MI Consumer Sentiment monthly report, US TIC Net Long-Term Transactions at Jan 18, US Building Permits at Jan 19, Australia Employment Change, Initial Jobless Claims, EIA Crude Oil Stocks Change at Jan 20 and Baker Hughes US Oil Rig Count at Jan 21.

AUD/USD Weekly outlook:

Technical View:

Last week’s high was 0.51% higher than the previous week. Maintaining high at 0.7313 and low at 0.7148 showed a movement of 165 pips.

In the upcoming week we expect AUD/USD to show a bullish trend.  The currency pair is trading above the 200 Simple Moving Average and the MACD trades to the upside. A solid breakout above 0.7295 may open a clean path towards 0.7386 and may take a way up to 0.7460. Should 0.7130 prove to be unreliable support, the AUDUSD may sink downwards 0.7056 and 0.6965 respectively. In H4 chart rounding bottom pattern favors prospects of a bullish trend. Also to be noted Bullish harami formation exerts the expectation of uptrend for the pair.

Preference
Buy: 0.7222 target at 0.7385 and stop loss at 0.7125


Alternate Scenario
Sell: 0.7125 target at 0.6966 and stop loss at 0.7222

USD/JPY Weekly Forecast (17th January 2022 – 21st January 2022)

Fundamental view:

The US dollar fell against many of its rival also against the Japanese yen during the trading course of the week. The fall of US dollar can be related to the US inflation. The Consumer Price Index was confirmed at 7% YoY in December, its highest since 1982. It is widely expected that the Federal Reserve policy makers are about to initiate a rate cycle at the March 16 meeting. With assuming the Fed meets forecasts with three 0.25% increases by December, the fed funds rate would only be 1% at the end of the year. For nearly seven years after the financial crisis of 2008-2009, the Fed kept the base rate at 0.25%, as it is now. On the other hand, In the upcoming week, the Bank of Japan meeting on Tuesday will produce no policy changes and if the bank reveals a new economic support package, it will have a little impact on the market.

In this week, Fed Chair Powell Testimony on 11th January and Japan Current Account n.s.a. on 12th January favored bullish trend whereas US CPI monthly report on 12th January and BoJ Corporate Goods Price Index yearly report on 14th January favored bearish trend for the pair.

The major economic events deciding the movement of the pair in the next week are BoJ Interest Rate Decision, US TIC Net Long-Term Transactions at Jan 18, US Building Permits at Jan 19, BoJ Monetary Policy Meeting Minutes, Initial Jobless Claims, EIA Crude Oil Stocks Change at Jan 20 and Baker Hughes US Oil Rig Count at Jan 21.

USD/JPY Weekly outlook:

Technical View:

Last week’s high was 0.43% lower than the previous week. Maintaining high at 115.85 and low at 113.48 showed a movement of 237 pips.

In the upcoming week we expect USD/JPY to show a bearish trend. The currency pair is trading below the 200 Simple Moving Average and the MACD trades to the downside. Should 113.16 proves to be unreliable support then the pair may fall further to 112.13 and 110.79 respectively whereas a solid breakout above 115.53 will open a clear path upward to 116.87 and then will further raise up to 117.90. In H4 chart, Formation of symmetrical triangle breakout downside indicates reversal of the trend creating prospects of a bearish trend Along with a shooting star formation braces our expectation.

Preference
Sell: 114.18 target at 112.14 and stop loss at 115.58


Alternate Scenario
Buy: 115.58 target at 117.89 and stop loss at 114.18

GBP/USD Weekly Forecast (17th January 2022 – 21st January 2022)

Fundamental view:

The British pound showed an uptrend against the greenback in this week, the catalyst behind this move is the US inflation. The greenback fell after inflation came at 7% YoY – the highest since 1982, while prospects of higher interest rates favor the underlying currency, the dollar reacted differently. The main reason is the undoing of bets on Fed hikes, which are already priced in. On the other hand, Uncertainty about the future of the PM and his successor has had limited influence on the pound so far. The entire UK is now showing a downtrend in infections, this update favored the sterling.

In this week, Fed Chair Powell Testimony on 11th January and UK Labour Productivity quarterly report on 12th January favored bearish trend whereas US CPI monthly report on 12th January and UK Manufacturing Production monthly report on 14th January favored bullish trend.

The major economic events deciding the movement of the pair in the next week are UK Claimant Count Change, US TIC Net Long-Term Transactions at Jan 18, US Building Permits at Jan 19, Initial Jobless Claims, EIA Crude Oil Stocks Change at Jan 20, UK Retail Sales monthly report and Baker Hughes US Oil Rig Count at Jan 21.

GBP/USD Weekly outlook:

Technical View:

Last week’s high was 1.11% higher than the previous week. Maintaining high at 1.3748 and low at 1.3531 showed a movement of 217 pips.

In the upcoming week we expect GBP/USD to show a bullish trend. The currency pair is trading above the 200 Simple Moving Average and the MACD trades to the upside. A solid breakout above 1.3772 may open a clean path towards 1.3869 and may take a way up to 1.3989. Should 1.3555 prove to be unreliable support, the GBPUSD may sink downwards 1.3435 and 1.3338 respectively. Chart formation of ascending triangle pattern breakout in H4 chart favors prospects of bullish trend. Bullish harami pattern formation escalates the expectation for a bullish trend.

Preference
Buy: 1.3677 target at 1.3868 and stop loss at 1.3550


Alternate Scenario
Sell: 1.3550 target at 1.3339 and stop loss at 1.3677