Why 2 traders see the same chart differently

A funny fact of trading is that you can choose two different traders and give them the exact same chart and also the same trading pattern, You will be surprised to get very different results.  All the things being equal such as knowledge, experience and access to information, then why do 2 different traders behave differently when they see the same chart?

Actually, there are lots of reasons behind reaching different conclusions. This article will spotlight few important factors that lead to several perspectives that can exist on the market at the same time: yours and those of your opponents (those who are on the other side of your position). With the help of thinking about these different perspectives and why they may exist, you can become a better trader.

1. Opposite trade or no trade position:

Traders have strong opinion of the chart if they are directly involved in the trade. Suppose a trader takes long position in EUR/USD and the other takes short position of the same quote, then each of them are probably going to defend their position.

Likewise a trader’s opinion about the chart will be different if he does not take the trade. 

Simple fact to understand is when you are demo-trading with virtual money; you are probably going to get good profits than when you trade live. It is because the money is virtual not real. The key to trading success truly is trying to forget about the money and trading the markets as if it’s all a game and the money is just a way of keeping score, a tally of points, so to speak.

Once you take a trade, it is like wearing colored glasses, It is going to influence your opinion regardless of trade being good or bad.

2. Following different Trading Strategy

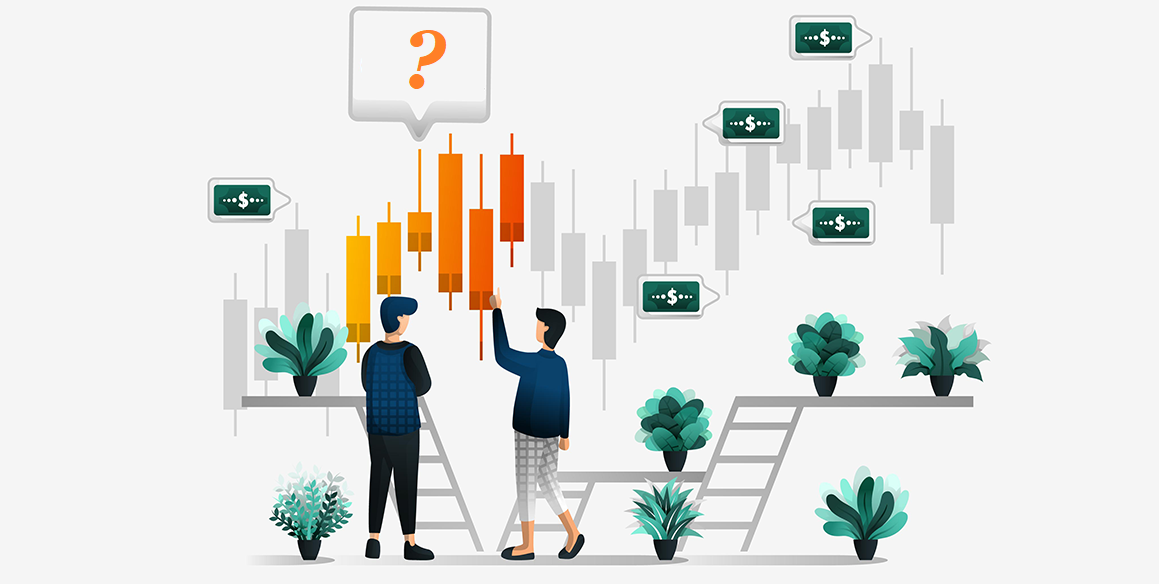
Difference opinion about a chart could arise from something as simple as having different trading strategies.

Suppose Trader A may see a chart going up, but he does not want to go along with the trend as he follows countertrend, he wants to short into the strength. He hates trading with the herd this he goes short.

Whereas on the other hand, Trader B may see that same chart going up and he is looking to go long!  He can’t ever seem to go against the herd thus he goes long.

We cannot judge whether either of this approach is right or wrong. However, it is more dangerous to trade against near-term trends, Few traders just have a knack at fading the market, or picking the places the market will reverse (contrarians). But for most traders, following the trend make the best bets.

3. Timeframe

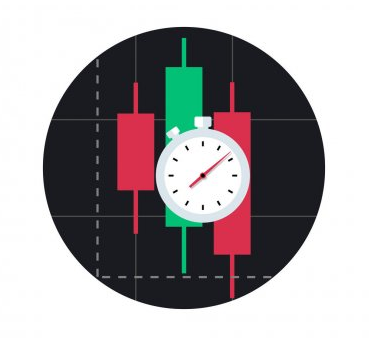
When traders who trade in different timeframe share their opinion of chart, it is pretty sure to have different perspective. If a trader is long swing trading position on the daily chart AUDUSD and he is talking with day trader. As they both discuss, day trader might have reasons why the AUDUSD will fall which make the swing trader to make second guess about the trade, or even alter it.

But the day trader could have been talking about what he thinks will happen in the next 24 hours, while the swing trader would take a couple of weeks to develop.

4. Recency bias

Two traders who are trading on the same chart may see the charts differently due to the reason called “recency bias”. Recency bias which means that you have a bias, opinion, or feeling about something due to an experience you recently had with the same thing or with something similar.

Suppose trader A might have faced the same scenario in which he might have made good profit whereas  trader B may have might have lost money under similar market conditions.

Being humans, we are all influenced by recent events more strongly than past ones, its just a part of being human. This can be prove to be good and bad in trading. Market conditions that are trending strongly lend to recency bias being beneficial as you will make profit if if you keep getting in the trend on pullbacks. Whereas on the other hand, when the trend changes and the market starts moving sideways, you will lose your money and end up with a loss.

 5. Varying trading skill level

Skill level will influence on how two traders will look at a chart. A more experienced trader might find price action a silly thing to follow and that a newbie might not be able to identify yet.

Normally, Newbies tend to jump from system to system a lot and get really excited about the last news that they just read. Thus if you plan to discuss with someone about a chart , make sure that they have some experience behind their statements.

6. Attached to the market Vs one’s initial vision

People can become emotionally attached to charts or simply their initial view of a chart for a variety of reasons.

Imagine a trader who has done extensive research on a market and studied a chart a lot thus he will likely get attached to a specific viewpoint. He will be with a view that the time he has spent studying the market must have value and he can’t accept to think that the market is not doing what he expects. This will in turn make him to watch the latest news and articles that support his perspective of the chart (after all, you can find any opinion on anything online). It’s basically about letting arrogance and one’s ego dictate one’s behavior. A trader can get attached to a chart just due to the reason that he does not wish to believe that he is wrong or that all of your research was done for nothing.

Whereas on the other hand, other trader who may not have this mental barrier (because he didn’t do any research) probably has an advantage over the above trader. When a trader spend less time on something, He will be more neutral and less committed. This gives you a new perspective and, above all, a more objective one. Being objectivite is beneficial in trading.

7. Technical indicators vs. “clean” charts

One other main reason on why 2 traders see the same chart differently is indicators. Some traders love to fill their charts with technical analysis indicators that make their charts look like works of modern abstract art.

Whereas Another trader who make use of simple, basic price action charts, without indicators, will inevitably have a different perspective on the same market.

Final words :

The above listed are some of the common reasons why two trades see a same chart very differently. Obviously, there’s no right and wrong when looking at a chart. Every trader has their own trading methods, experiences and biases that tell what a good trade looks like.

If you find someone in a bad trade or wish to alter your trading, depending on the opinion of others, be sure to remember the above reasons. They are perfectly good reasons why your opinion is just as valid as the opinion of another trader.

Follow your own trading plan and let your edge work for you.

Happy trading !!!

Firmer Treasury yields favors USD

Japanese Nikkei declined against the US dollar during the Asian session Tuesday. This move can be related to the firmer US Treasury yields and the risk-off market mood.

The US Treasury yields posted 2.3 basis points (bps) of an upside to 1.42% after declining to the monthly lows.

On the other hand, Japanese policymakers are about to revise the Financial Year (FY) 2022 GDP forecast hoping for relief from a multi-billion dollar worth of budget. As per a recent news, It was reported that “Japan is considering raising its forecast for fiscal 2022 real gross domestic product (GDP) growth to 3.0% or more after taking into account the impact of a record $317 billion extra budget.

The projection would be an upgrade from a forecast for 2.2% real GDP growth for the fiscal year starting in April 2022 released at a mid-year review in July. The cabinet was set to approve the new forecast, which comes after parliament on Monday approved the 36 trillion yen ($316.73 billion) extra budget for the current fiscal year, on Thursday.”

The Omicron woes creates a risk off mood in the market. World Health Organization (WHO), the US Centers for Disease Control and Prevention (CDC) and the Imperial College of London have highlighted fears of the South African covid variant, named as Omicron.

As per reuters WHO said, “The Omicron variant of the coronavirus is spreading faster than the Delta variant and is causing infections in people already vaccinated or who have recovered from the COVID-19 disease.”

The US CDC and the UK Scientists were also fearful of the virus variant. The former said, “Omicron is now the most common coronavirus variant in the US, accounting for nearly three-quarters of COVID-19 cases,” while the latter mentioned, per Reuters, “Infections caused by the Omicron variant of the coronavirus do not appear to be less severe than infections from Delta.”

It has to be noted that Friday’s comments from Fed Board of Governors member Christopher Waller renewed the call for the Fed-rate-hike and favored the US dollar. As per reuters policymakers said “The ‘whole point’ of the Fed’s decision to accelerate the pace of its QE taper was to make the March Fed meeting “live” for a first rate hike.”

USD/JPY 4 Hour Chart:

Support: 113.33 (S1), 113.13 (S2), 112.93 (S3).

Resistance: 113.74 (R1), 113.94 (R2), 114.14 (R3).

A light calendar and the year-end holiday mood may restrict USD/JPY moves. However amidst all the catalysts framing a favorable environment for dollar now, we expect a bullish trend for USD/JPY.

PBOC’s rate cut weighs on Aussie

Aussie traded downside against the greenback on Monday. The drop can be linked to multiple catalysts – Omicron fear creating sour sentiment in the market, People’s Bank of China’s (PBOC) surprise rate cut and Slump of the Magellan Financial Group to its worst session on losing a major client.

Growing fears on the omicron virus creates sour sentiment in the Market. Analysts at National Australia Bank said “Markets are very cautious ahead of the Christmas break, with concerns about the impact of the Omicron strain.” “More discontinuity in supply chains from Omicron could add to inflation concerns.”

The People’s Bank of China made a surprise announcement of a five basis points (bps) of a cut to the benchmark one-year Loan Prime Rate (LPR) top 3.80% meanwhile keeping the five-year rate intact around 4.65%. This in turn created economic worries in Australia (largest customer).

Elsewhere, China’s troubled firm Kaisa tries to create market optimism, However it fails to do, while filing for resumption of trading of the company’s shares. Moreover Reuters reported, “It has not received any notice from bondholders to accelerate repayments yet as the embattled Chinese property developer has not repaid a $400 million bond, or interest on notes due in 2023 and 2025.”

Magellan Financial Group MFG.AX plunged 32.9% after disclosing it had lost its largest client St James’s Place SJP.L, which accounted for around 12% of the company’s annual revenue.

On the other hand, Hawkish comments from Fed favored the greenback. Fed Governor Chris Waller said on Friday that he thought a rate increase in March would be “very likely” and that the central bank could start to run down it balance sheet in mid-2022. Meanwhile, erstwhile dove Mary Daly, president of the San Francisco Fed, refused to rule out a March increase and voiced support for as many as three increases next year.

Ken Cheug, chief Asian foreign-exchange strategist at Mizuho Bank said “The Fed’s rapid hawkish tilt combined with Omicron’s troubling spread intensified a risk-off mood, which led investors to squirrel away their capital in safe havens, including Treasuries and the dollar, with moves exacerbated by year-end profit taking.”

AUD/USD 4 Hour Chart:

Support: 0.7101 (S1), 0.7080 (S2), 0.7039 (S3).

Resistance: 0.7164 (R1), 0.7205 (R2), 0.7227 (R3).

All the catalysts weighs on the Australian dollar while favoring the Safe-haven US dollar. We expect a bearish trend for AUD/USD.

BTC/USD Weekly Forecast (20th December 2021 – 24th December 2021)

Fundamental view:

Bitcoin traded high at the beginning but later turned downside against the greenback during the trading course of the week. Inflation concerns and fear about the future of the global economy continue to put weigh on Bitcoin prices, and currently, the Crypto Fear & Greed Index is solidly in the “fear” zone where it has been parked since the beginning of December.

The bitcoin had a fall following the recent Federal Open Market Committee meeting where Fed Chair Jerome Powell indicated that interest rates would remain low for the time being and the overall sentiment in the crypto market continues to wane, signaling that 2021 could end on a bearish note.

On the other hand, Willy Woo, a popular analyst stated, long term holders have been selling down and taking profits, but as a cohort they continue to be in a region of peak accumulation. Bear markets coincide when these holders have divested of their coins, despite the fear in the market, structurally we are not setup for a bear market.

The major economic events deciding the movement of the pair in the next week are GDP quarterly report, CB Consumer Confidence Index, EIA Crude Oil Stocks Change at Dec 22, Core Durable Goods Orders monthly report, Initial Jobless Claims and Michigan Consumer Sentiment at Dec 23 for US.

BTC/USD Weekly outlook:

Technical View:

Last week’s high was 3.13% lower than the previous week. Maintaining high at 50359.9 and low at 45477.5 showed a movement of 4882 pips.

In the upcoming week we expect BTC/USD to show a bearish trend. The Instrument is trading below the 200 Simple Moving Average and the MACD trades to the downside. Should 43886.2 proves to be unreliable support then the pair may fall further to 42240.6 and 39003.7 respectively whereas a solid breakout above 48768.6 will open a clear path upward to 52005.4 and then will further raise up to 53651.0. In H4 chart rounding top pattern formation favors prospects of a bearish trend. Bearish engulfing pattern constructs a bearish outlook for the pair in the upcoming week.

Preference
Sell: 45877.8 target at 41099.3 and stop loss at 48772.6


Alternate Scenario
Buy: 48772.6 target at 53650.5 and stop loss at 45877.8