
What is Swing trading?
Swing trading is a speculative trading strategy where a tradable asset is held for one or more days in an effort to profit from price changes or ‘swings’. It has been described as a kind of fundamental trading in which positions are held for longer than a single day but shorter than buy and hold strategies that can be held for months or years.
Most fundamental traders are swing traders since changes in corporate fundamentals generally require several days or even a week to cause sufficient price movement to render a reasonable profit.
Swing trading lies in the middle of the continuum between day trading to trend trading. A day trader will hold a tradable asset anywhere ranging from a few seconds to a few hours but not more than a day whereas a trend trader will examine the long-term fundamental trends of a tradable asset and may hold it for a few weeks or months.
Swing traders hold a tradable asset a period of time which generally ranges from a few days to two or three weeks, that falls between those extremes, and they will trade the tradable asset on the basis of its intra-week or intra-month swinging between optimism and pessimism.
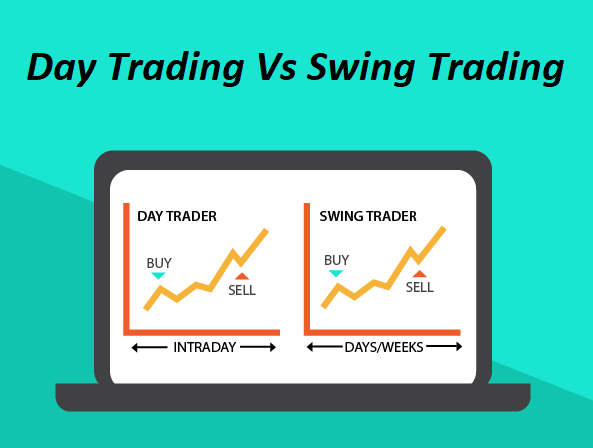
Day Trading Vs Swing Trading
Day trading and Swing trading may appear like similar practices but the major difference between the two to be said in a single word is time. Let’s compare both of them in depth.
Time frame: Day trading means getting in and out of trades within minutes or hour whereas Swing trading is generally over days or weeks.
Gap opening risk: The shorter time frame of day traders means they don’t hold positions overnight. Hence, they avoid the risk of gaps from news announcements coming in after hours and causing a big move against them. On the other hand, swing traders should be alert that a tradable asset could open significantly different from what it closed the day before.
Commission: In shorter time frame, wide spread between the bid, the ask and commissions can eat a large portion of your profits. Day traders can find themselves doing all the work, and at last get less or no profit due to spread and commission. Whereas Swing traders can also struggle with this, but its effect is more for the day trader.
Time commitment: Proper day trading requires focus and attention on numerous positions and constantly looking for new potential opportunities throughout the day to replace exited positions. That means this cannot be treated as one of a job but a full time job instead.
This dependency might cause more stress. Not having a steady paycheck makes a day trader’s income reliant on trading success. That can add an extra level of stress and emotions to trading, and more emotions in trading lead to poor decisions.
On contrary, Swing trading may have a few transactions some days and nothing on others. Positions can be checked periodically, just need to be alert when critical price points are reached rather than the need for constant monitoring. This allows swing traders to diversify their investments.
Swing trading is the right choice for you if you have the below qualities
- You will not mind holding your trades for several days.
- You are ready to take fewer trades and will focus on good trade setups.
- You are patient.
- You will remain calm if trade goes against you.
- You will set large stop losses.
Swing Trading is not a right choice for you in case you are one of the above
- You are interested in fast-paced, action-packed trading.
- You are impatient and can’t wait for the trade to run for a day.
- You can’t take it easily when trade go against you
Suppose you have a full time job but enjoy trading too, then swing trading might be a right choice for you. Keep in mind that every trading style has its pros and cons, and it is up to you the trader to choose which one you will be apt for you.
Trading Strategies
We have listed some of the strategies that you can use to identify trading opportunities and manage your trades.
1. Fibonacci retracement
The Fibonacci retracement can be used to help the traders to identify support and resistance levels. Based on this indicator, they can find market reversal opportunities. Fibonacci ratios of 23.6%, 38.2% and 61.8% are believed to reveal potential reversal levels.
A swing trader may enter a buy trade when the price is in a downward trend and seems to find support at the 61.8% retracement level from its previous high.
Go through our book on Fibonacci and understand Fibonacci in depth.
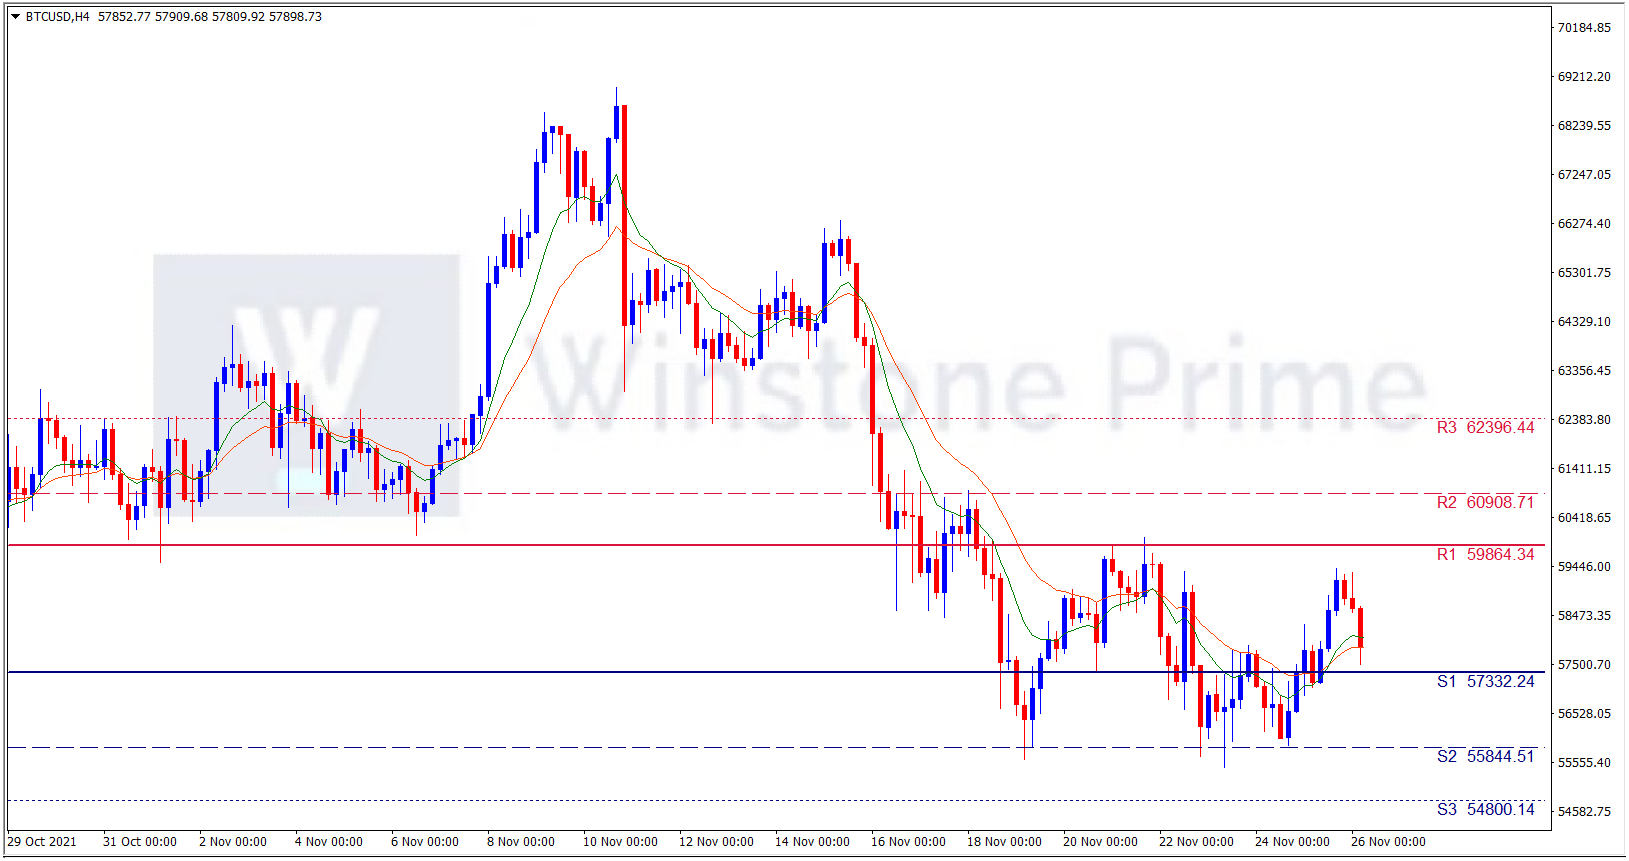
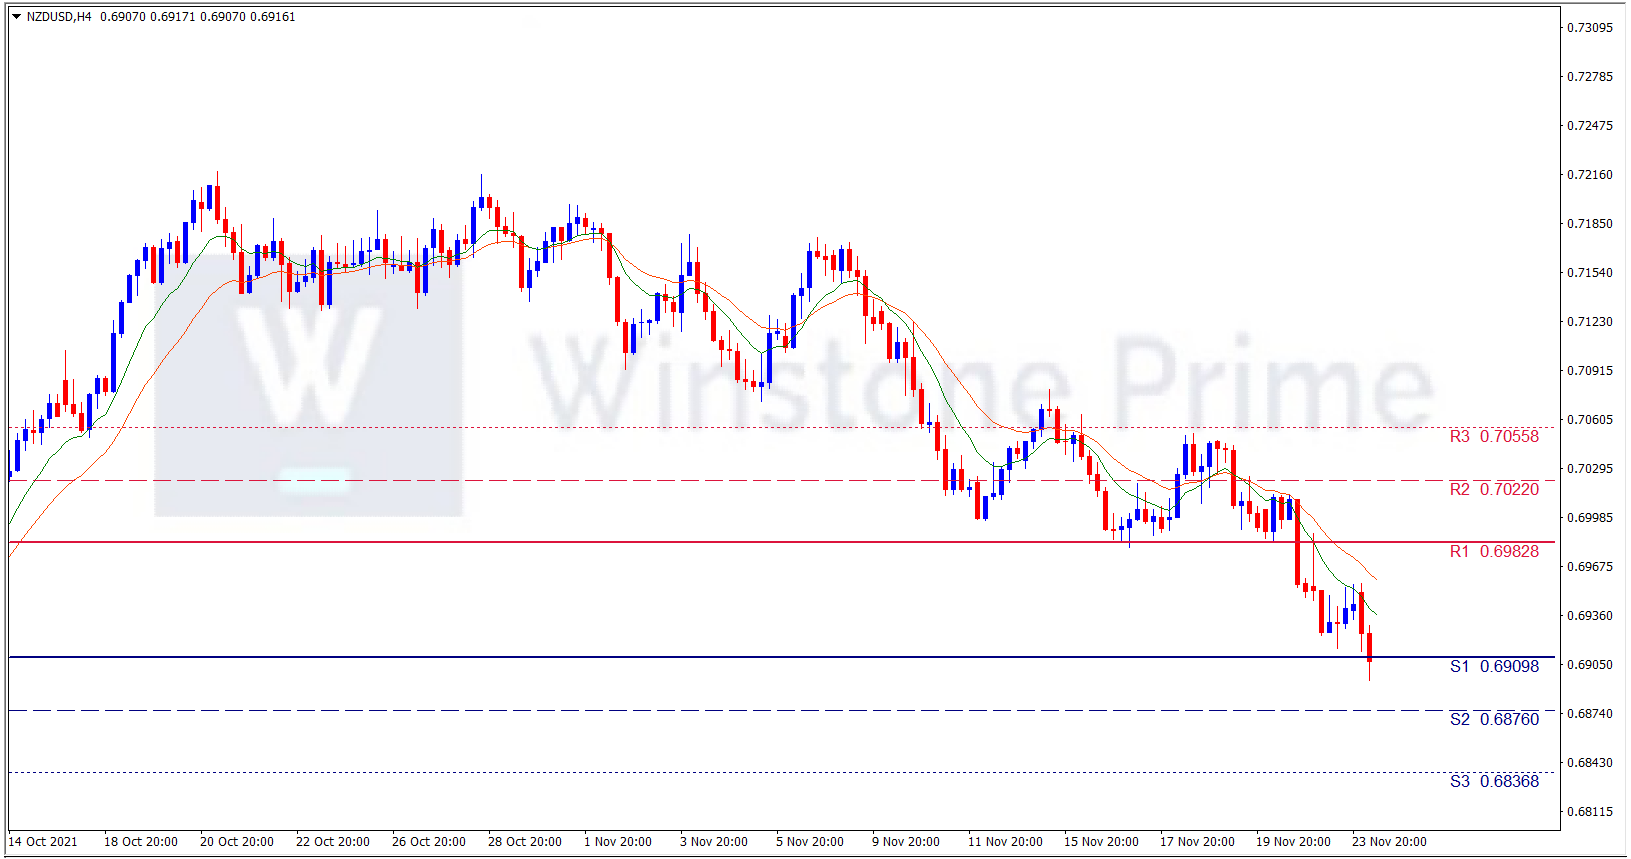
2. Support and resistance
Support and resistance are critical tools in technical analysis.
A Resistance level represents a price level or area above the current market price where the selling may overcome buying pressure thus breaking the uptrend and making the price to turn back down. Here, a swing trader could enter a sell position on the bounce off the resistance level and place a stop loss above the resistance line.
Support is opposite of resistance. Support is a price level or area on the chart which is below the current market price where buying is strong enough to overcome selling pressure. Hence price stops from falling and price turns raises again. A swing trader would look to enter a buy trade on the bounce off the support line and places a stop loss below the support line.
An important aspect to remember in using Support and Resistance in swing trading is that when price breaches a support or resistance level, they switch roles –Once called a support then becomes a resistance and vice versa. Acquire full knowledge of Support and Resistance.
3. Channel trading
Channel trading requires you to identify a tradable asset that is displaying a strong trend and which is trading within a channel. Suppose you have plotted a channel around a bullish trend on a chart, you would consider opening a long position when the price rises up from the bottom line of the channel. While using channels to swing-trade, it is very important to trade with the trend, in the above example where the price is in uptrend, you would only go for buy trades – unless price breaks out of the channel, moving lower and indicating a reversal and the beginning of an downtrend. Learn How to trade the Channel pattern.
4. Japanese candlesticks
Most of the traders prefer to use the Japanese candlestick charts since they are easier to understand and interpret. Candlesticks can be used to examine price action over any timeframe, from one second up to an entire year. Traders make use of specific candlestick patterns to identify trading opportunities.
After reviewing the popular swing trading strategies, follow the below steps and start swing trading
- Open a live trading account: First open a live trading account to start swing trading. Before opening a live account, we recommend you to open demo account to practice the above swing trading strategies in a risk-free environment.
- Analyze the market technically and fundamentally: Use any of strategies listed above or your preferable strategy to analyse the market technically. Also analyse the market fundamentally
- Choose a tradable asset based on your research: Once you have undertaken your research, make a decision on which asset and what time frame you wish to swing trade. Also make a decision on your entry and exit strategy based off your swing trading signal.
- Make use of risk management tools: Make use of Stop loss and take profit order to mitigate the risks involved. These risk management tools will help you to keep your trades consistent and relevant to the trading strategy you use.
- Monitor your position regularly: Monitor your trade which is open. Be aware of gapping and slippage, and changes within the market’s sentiment.
- Exit trade if needed: Suppose the trade has not been exited by your stop loss, close the trade as per your swing trading strategy.
Final words :
In short, Swing trading refers to the trading style that is used by traders who try to profit from price swings. It attempts to identify “swings” within a medium-term trend and enter only when there seems to be a high probability of winning. Whereas it requires a comprehensive understanding of technical and fundamental analysis , it can result in more efficient returns, relative to day trading. Just like any form of trading, there will be risks involved. Open account now and practice swing trading.
Happy Trading !!!