XAU/USD Weekly Forecast (22nd November 2021 – 26th November 2021)

Fundamental view:

Gold struggled to build on the previous week’s inflation-fueled rally and ended with a weekly bearish candle. The Rising US Treasury bond yields favored the greenback and pressurized the Dollar in the beginning of the week. Later the upbeat US data favored the US dollar and underpinned the bearish trend of the pair. The US Department of Labor’s weekly publication portrayed that there were 268,000 initial claims for unemployment benefits in the week ending November 13 which was better than the expectation. Additionally, The Federal Reserve Bank of Philadelphia reported that business activity in the Third Federal Reserve District expanded at a strong pace in November.

On the other hand, Fed officials delivered mixed comments on the policy outlook which turned to be negative for the dollar. Further Factors like rising COVID-19 cases in Eastern Europe like Austria is in a lockdown for 20 days, and Increase in Germany’s covid cases above March 2020 high, dented investors mood. Adding to it, the health minister said he could not rule out another lockdown in Germany as infections surge aggressively in the largest Eurozone economy. This also leads to the downbeat market sentiments.    

The major economic events deciding the movement of the pair in the next week are US Markit Manufacturing PMI at Nov 23, US GDP quarterly report, US Core Durable Goods Orders monthly report, US Initial Jobless Claims, EIA Crude Oil Stocks Change, Michigan Consumer Sentiment and FOMC Minutes at Nov 24 for US.

XAU/USD Weekly outlook:

Technical View:

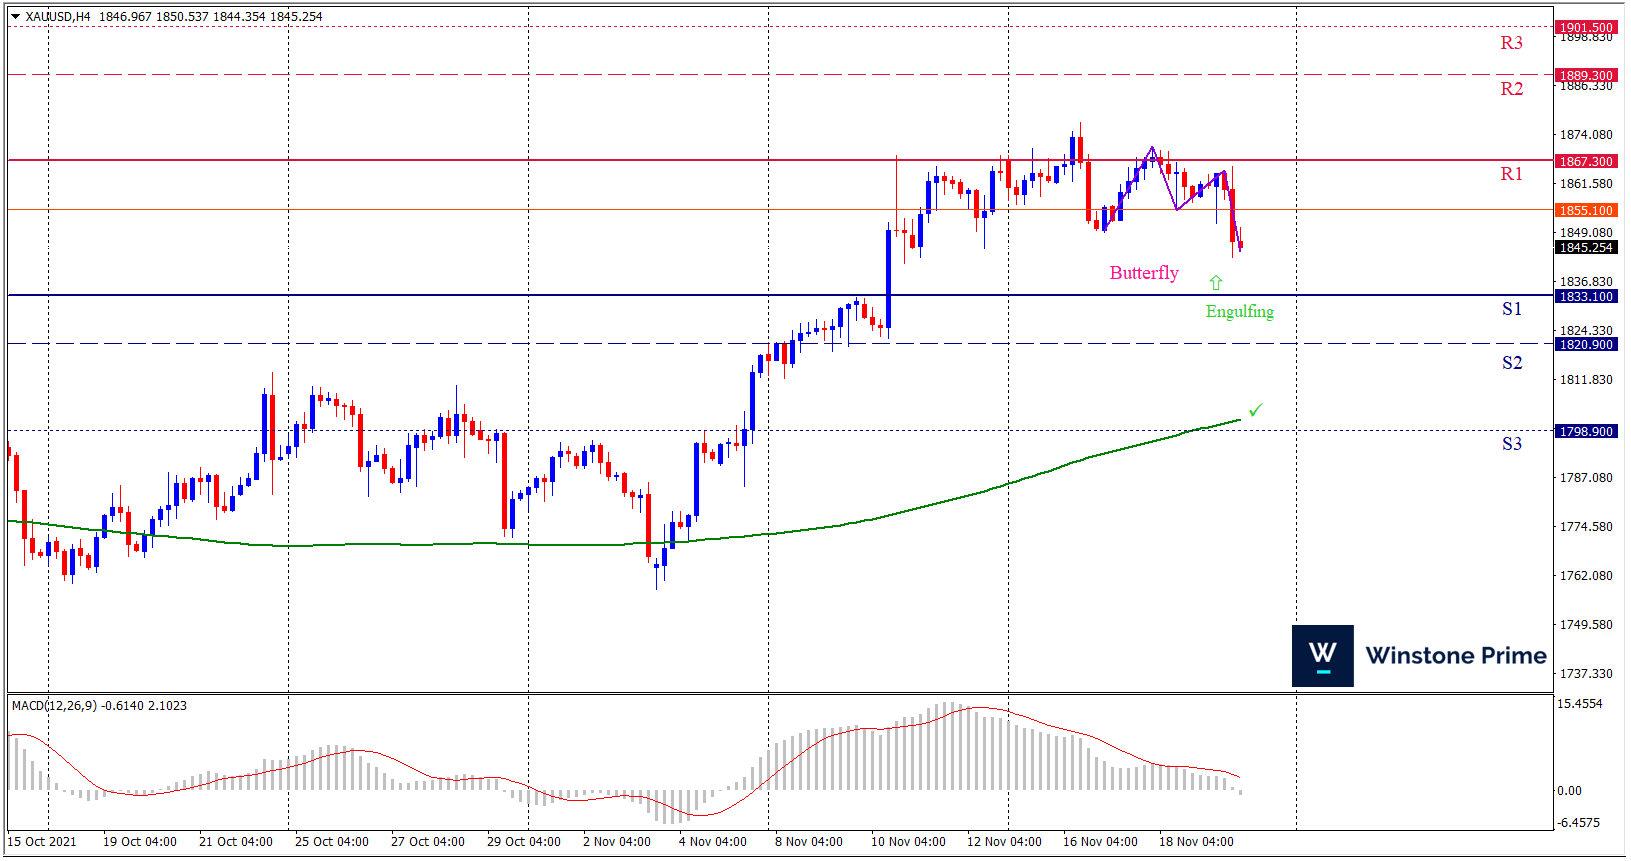
Last week’s high was 0.45% higher than the previous week. Maintaining high at 1877.1 and low at 1842.9 showed a movement of 342 pips.

In the upcoming week we expect XAU/USD to show a bullish trend. The Instrument is trading above the 200 Simple Moving Average and the MACD trades to the downside. A solid breakout above 1867.3 may open a clean path towards 1889.3 and may take a way up to 1901.5. Should 1833.1 prove to be unreliable support, the XAUUSD may sink downwards 1820.9 and 1798.9 respectively. In H4 chart bullish butterfly pattern favors prospects of a bullish trend. Also to be noted Bullish engulfing formation exerts the expectation of uptrend for the pair.

Preference
Buy: 1847.5 target at 1880.3 and stop loss at 1828.7


Alternate Scenario
Sell: 1828.7 target at 1799.9 and stop loss at 1847.5

AUD/USD Weekly Forecast (22nd November 2021 – 26th November 2021)

Fundamental view:

Aussie initially tried to rally but later fell hard against the greenback during the trading course of the week. The broad US dollar strength and return of covid and related lockdowns pushed the pair down. Austria instituted a partial lockdown and Germany imposed restrictions amid rising case counts that go against high vaccination rates in both countries. Meanwhile US Federal Reserve is moving towards rate hikes in 2022 whereas Reserve Bank of Australia (RBA) is expecting none. On Tuesday, RBA Governor Philip Lowe noted that  “the economy and inflation would have to turn out very differently from our central scenario for the Board to consider an increase in interest rates next year.” 

In this week, US Business Inventories monthly report on 16th November and RBA Assistant Governor Ellis Speech on 18th November created uptrend whereas US Initial Jobless Claims on 18th November and  US EIA Crude Oil Stocks Change on 17th November created downtrend for the pair.

The major economic events deciding the movement of the pair in the next week are US Markit Manufacturing PMI at Nov 23, US GDP quarterly report, US Core Durable Goods Orders monthly report, US Initial Jobless Claims, Michigan Consumer Sentiment, FOMC Minutes at Nov 24, Australia Private New Capital Expenditure quarterly report at Nov 25 and Australia Retail Sales monthly report at Nov 26.

AUD/USD Weekly outlook:

Technical View:

Last week’s high was 0.83% lower than the previous week. Maintaining high at 0.7370 and low at 0.7226 showed a movement of 144 pips.

In the upcoming week we expect AUD/USD to show a bearish trend. The currency pair is trading above the 100 Simple Moving Average and the MACD trades to the downside. A firm breakout below 0.7181 may make a fall to 0.7131 and then fall further to 0.7037. Should 0.7325 prove to be unreliable resistance, the AUDUSD may raise upwards 0.7419 and 0.7469 respectively. In H4 chart formation of inverted cup and handle pattern favors prospects of a bearish trend. Also to be noted bearish harami formation exerts the expectation of downtrend for the pair.

Preference
Sell: 0.7231 target at 0.7099 and stop loss at 0.7330


Alternate Scenario
Buy: 0.7330 target at 0.7468 and stop loss at 0.7231

USD/JPY Weekly Forecast (22nd November 2021 – 26th November 2021)

Fundamental view:

The US dollar has rallied significantly during the course of the week and broke the ¥115 level. The Good US Retail Sales report along with a Consumer Price Index (CPI) at its highest level since 1990 favored the US dollar and in turn may allow the Fed to end its $120 billion bond buying program as targeted by June 2022. Proof of a strengthening recovery might be enough for the Federal Open Market Committee (FOMC) to advance its taper timetable at the December 15 meeting. The US economy outperformed the Japanese economy this week and seem to continue to do so in the upcoming week.

In this week, Japan GDP quarterly report on 15th November and US Building permits on 17th November favored bearish trend whereas US Retail Sales monthly report on 16th November and Japan CPI yearly report on 19th November favored bullish trend for the pair.

The major economic events deciding the movement of the pair in the next week are US Markit Manufacturing PMI at Nov 23, Japan Markit Manufacturing PMI, US GDP quarterly report, US Core Durable Goods Orders monthly report, US Initial Jobless Claims, Michigan Consumer Sentiment, FOMC Minutes at Nov 24 and Japan Coincident Index at Nov 25.

USD/JPY Weekly outlook:

Technical View:

Last week’s high was 0.58% higher than the previous week. Maintaining high at 114.97 and low at 113.58 showed a movement of 139 pips.

In the upcoming week we expect USD/JPY to show a bullish trend. The currency pair is trading above the 200 Simple Moving Average and the MACD trades to the downside. A solid breakout above 114.80 may open a clean path towards 115.58 and may take a way up to 116.19. Should 113.41 prove to be unreliable support, the USDJPY may sink downwards 112.80 and 112.02 respectively. In H4 chart, Formation of bullish gartley pattern indicates reversal of the trend creating prospects of a bullish trend additionally hammer formation braces our expectation.

Preference
Buy: 114.21 target at 115.57 and stop loss at 113.36


Alternate Scenario
Sell: 113.36 target at 112.03 and stop loss at 114.21

GBP/USD Weekly Forecast (22nd November 2021 – 26th November 2021)

Fundamental view:

Pound managed to overcome the downtrend and traded high against the greenback. Although Brexit talks impacted the cable, it took advantage of improved market mood which weighed on the US dollar.  Drop in UK jobless claims in October and rise of inflation to 4.2% YoY in October, higher than the 3.9% forecast by economists and increase in consumer buying in November underpinned the bullish trend of the pair. UK still waves the stick of triggering Article 16, a unilateral suspension of the Withdrawal Agreement and talks about the Northern Irish protocol continues. On the other hand, many Fed speakers had public appearances, Hawkish speakers were same hawkish whereas doves were dovish and some in middle remained silent, this mixed views also made dollar hard to find demand as a safe haven asset.  

In this week, Britain Core retail sales yearly report and Baker Hughes US Oil Rig Count on 19th November favored bearish trend for the pair whereas US Building Permits and Britain CPI monthly report on 17th November and Kansas City Fed Manufacturing Composite Index favored bullish trend for the pair.

The major economic events deciding the movement of the pair in the next week are BoE MPC Member Haskel Speech, US Markit Manufacturing PMI at Nov 23, US GDP quarterly report, US Core Durable Goods Orders monthly report, US Initial Jobless Claims, Michigan Consumer Sentiment, FOMC Minutes at Nov 24 and BoE MPC Member Pill Speech at Nov 26.  

GBP/USD Weekly outlook:

Technical View:

Last week’s high was 0.70% lower than the previous week. Maintaining high at 1.3513 and low at 1.3396 showed a movement of 117 pips.

In the upcoming week we expect GBP/USD to show a bearish trend.  The currency pair is trading below the 200 Simple Moving Average and the MACD trades to the downside. A firm breakout below 1.3386 may make a fall to 1.3332 and then may take a way down to 1.3269. Should 1.3503 prove to be unreliable resistance, the GBPUSD may raise upwards 1.3566 and 1.3620 respectively. Chart formation of symmetrical triangle pattern breakout in H4 chart favors prospects of a bearish trend. Bearish harami pattern formation escalates the expectation for a bearish trend.

Preference
Sell: 1.3448 target at 1.3333 and stop loss at 1.3508


Alternate Scenario
Buy: 1.3508 target at 1.3619 and stop loss at 1.3448