EUR/USD Weekly Forecast (22nd November 2021 – 26th November 2021)

Fundamental view:

The Euro has broken significantly during the course of the week and slumped to its weakest level since July 2020 at 1.1263 on Wednesday due to the greenback continuing to gain strength on inflation fears. The quote has lost more than 1% for this week. ECB Governing Council Member Isabel Schnabel said that the ECB’s decision to continue to buy bonds was a sign that a rate hike was not imminent. Isabel Schnabel added that the rise in inflation was a welcome development.  As a reply, European Central Bank (ECB) President Christine Lagarde crossed the wires on Friday and argued that it wouldn’t make sense to tighten the policy prematurely when inflation pressures are expected to fade. “Tighter policy would only exacerbate the contractionary effect on the economy,” He said.  On Friday, Austria announced a nationwide lockdown due to the rising number of coronavirus cases which made the pair to fall further. Amidst all the catalysts, Euro portrayed a downtrend.

In this week, Eurozone Employment change on 16th November and US Building Permits on 17th November favored uptrend whereas US Retail sales monthly report on 16th November and ECB President Lagarde Speech on 19th November favored downtrend for the pair 

The major economic events deciding the movement of the pair in the next week are US Markit Manufacturing PMI at Nov 23, Eurozone Business Climate, US GDP quarterly report, US Core Durable Goods Orders monthly report, US Initial Jobless Claims, Michigan Consumer Sentiment, FOMC Minutes at Nov 24, Eurozone GDP quarterly report and ECB Monetary Policy Meeting Accounts at Nov 25.

EUR/USD Weekly outlook:
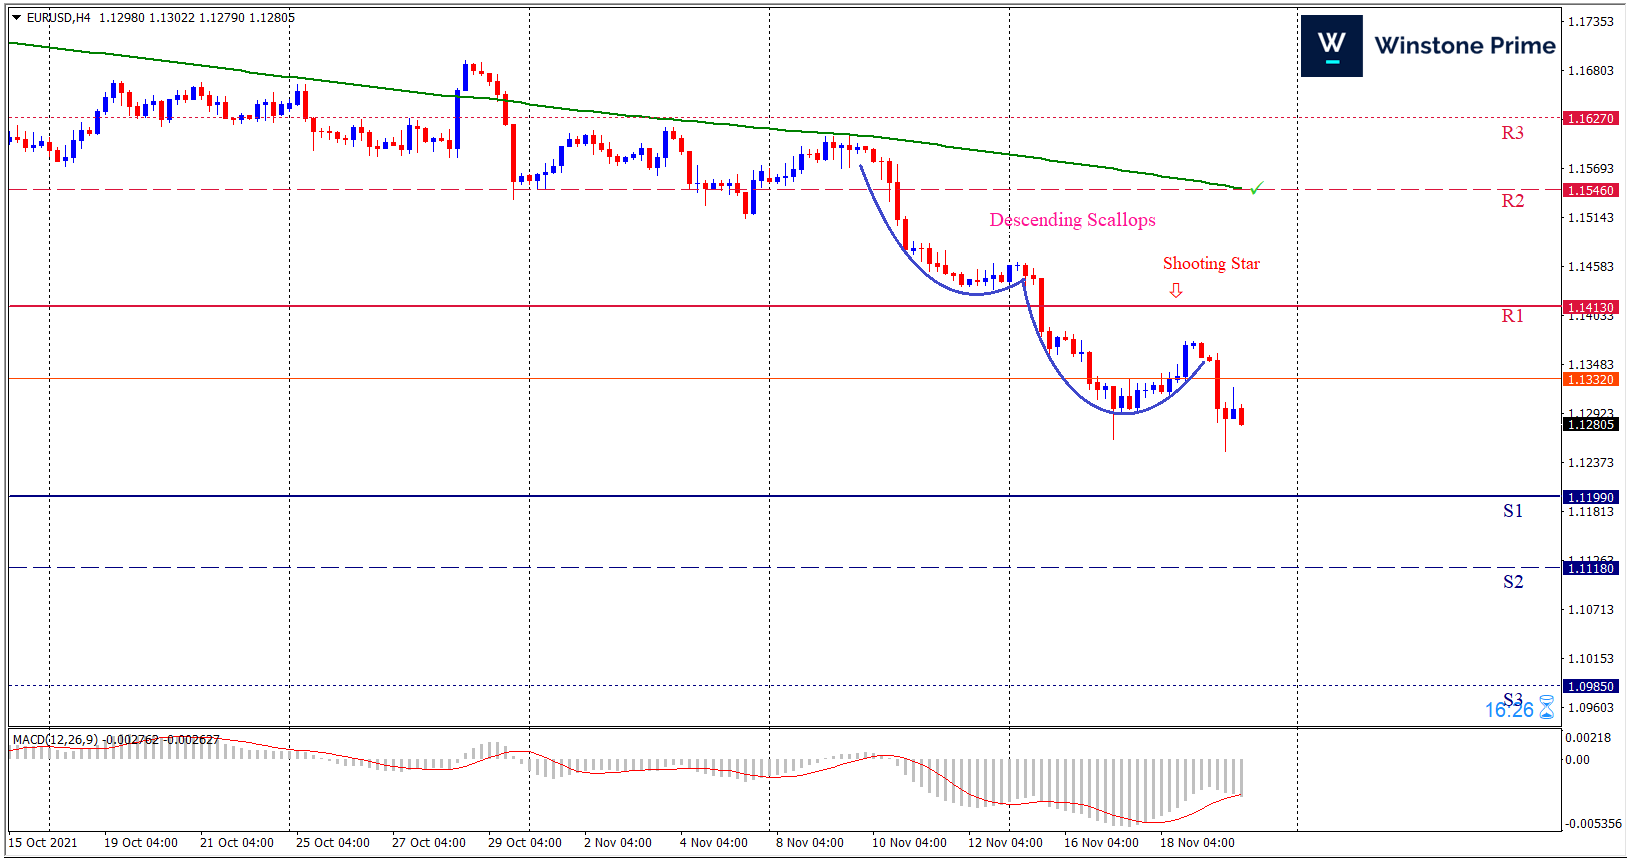
Technical View:

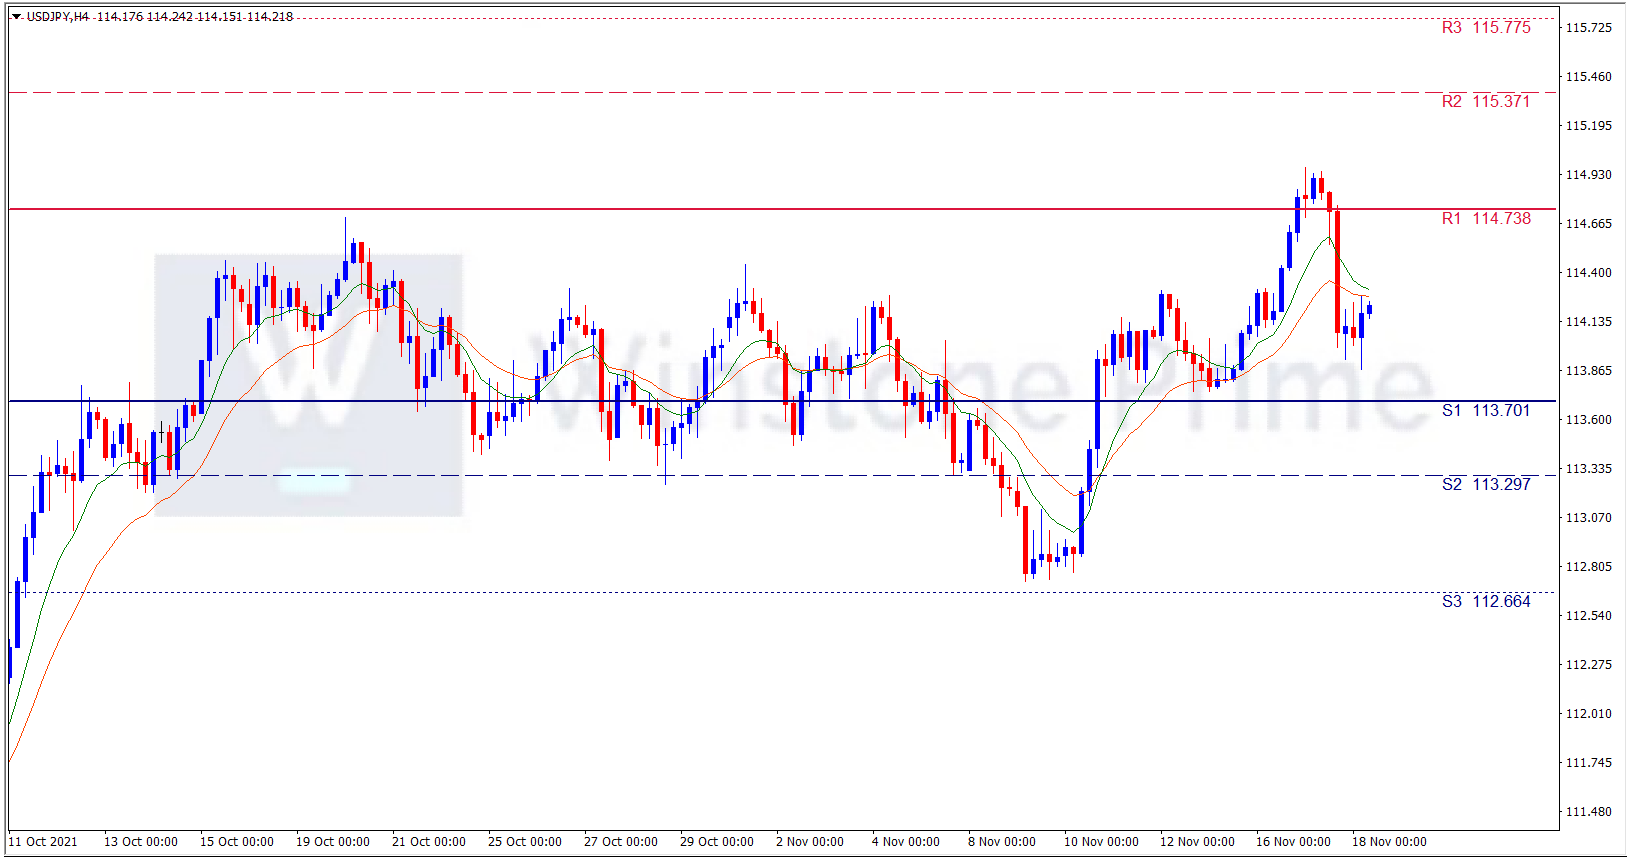
Last week’s high was 1.24% lower than the previous week. Maintaining high at 1.1464 and low at 1.1250 showed a movement of 214 pips.

In the upcoming week we expect EUR/USD to show a bearish trend. The currency pair is trading below the 200 Simple Moving Average and the MACD trades to the downside. A solid breakout below 1.1199 may create a fall to 1.1118 and may take a way down to 1.0985. Should 1.1413 prove to be unreliable resistance, the EURUSD may raise upwards 1.1546 and 1.1627 respectively. Chart formation of a descending scallop’s pattern in H4 chart sets prospects for a bearish trend. Shooting star formation in H4 chart escalates the expectation for a bearish trend.

Preference
Sell: 1.1281 target at 1.1098 and stop loss at 1.1418


Alternate Scenario
Buy: 1.1418 target at 1.1626 and stop loss at 1.1281

What is a trailing stop loss

A trailing stop loss is a risk-management tool. It is a type of day trading order that allows you set a maximum value of loss you can incur on a trade. If the security price rises or falls in your favor, the stop price moves with it. If the security price rises or falls against you, the stop will stay at the place.

Understanding Trailing stop loss:

Firstly, stop loss order is an order type that helps to manage risk by specifying a point at which your trade should be closed if the price moves against you. By using stop-loss you can ensure that your losses are limited. Stop-loss orders will remain in effect until your order is closed or you choose to cancel the order.

Now let’s move to A trailing stop which is also called a trailing stop-loss, enhances the efficacy of a stop-loss by pairing it with a trailing stop, Trailing stop loss order is a trade order where the stop-loss price isn’t fixed at a single, absolute dollar amount, but is rather set at a certain level . Thus the stop-loss then trails behind the stock as its price moves.

Use of Trailing stop loss:

A trailing stop is designed to lock in gains by enabling a trade to remain open and continue to profit as long as the price is moving in the investor’s favor. The order closes the trade if the price changes direction by a specified points.

A trailing stop is typically placed at the same time the initial trade is placed, although it may also be placed after the trade.

A trailing stop can also be powerful over a regular stop-loss if the market price moves in your favor but then reverses, as your stop-loss will have followed the favourable price moves but will not move in the opposite direction. Similar to a regular stop-loss, once the instrument’s price hits your trailing stop-loss level, your trade will be closed at the next available price, preventing you from holding on to a losing trade and being at risk of losing more money.

A trailing stop-loss order is placed in the similar way as stop loss. For example, a trailing stop for a buy trade would be a sell order and it will be placed at a price that is below the trade entry point. The main difference between a regular stop loss and a trailing stop loss is that the trailing one moves whenever the price moves in your favor.

Let’s understand it with an example, A buy order of EUR/USD is placed at 1.1443 and trailing stop is set at for every 200 points that the price moves up, the trailing stop would also move up 200 points. If the price moves up 200 points, the stop loss will also move up 200 points. But if the price starts to fall, the stop loss doesn’t move.

In this above example, 1 lot of EUR/USD trade is entered at 1.1443 with 200-points trailing stop at 1.1423. If the price then moves up to 1.1473, the trailing stop would move to 1.1453. At 1.1473, the trailing stop would move to 1.1453.

If the price then moves back down to 1.1463, the trailing stop would stay at 1.1453. If the price continues down and reaches 1.1453, the trailing stop-loss order would be converted to a market order, and you would be able to exit the trade at about 1.1453 thus lock in 100 points profit.

The same works even for a short trade except that you are expecting the price to drop, so the trailing stop loss is placed above the entry price.

To set a Trailing Stop, right-click the open position in the ‘Terminal’ window and then specify your desired pip value (in points) of distance between the TP level and the current price in the Trailing Stop menu.

Your Trailing Stop will then become active. This means that if prices change to the profitable market side, Trailing stop will ensure the stop loss level follows the price automatically.

You can easily disable trailing stop loss by setting ‘None’ in the Trailing Stop menu. If you want to quickly deactivate it in all opened positions, just select ‘Delete All’.

The main key to remember while using a trailing stop successfully is to set it at a level that is neither too tight nor too wide.  If a trailing stop loss that is too tight that could mean the trailing stop is triggered by normal daily market movement, and hence the trade will get no room to move in the trader’s direction. A too tight stop loss will led to a losing trade, however a small one.

On the other hand, If a trailing stop that is too large then it will not be triggered by normal market movements, but it mean that the trader is taking on the risk of unnecessarily large losses, or giving up more profit than they need to.

A trailing stop locks in profit and limit losses but establishing the ideal trailing stop distance is a difficult task There is no ideal distance because markets and the way that stocks move are always changing. Despite this, trailing stops are effective tools.

As already discussed, trailing stop-loss orders can get you out of a trade too soon. It can happen in a situation when price is pulling back a bit, not actually reversing thus ending the trade too early. This is a major drawback of TS.

In order to prevent that scenario, trailing stops should be placed at a distance from the current price that you do not expect to be reached unless the market changes its direction.

Another drawback is that trailing stops does not protect you from any major market moves that are greater than your stop placement.

If you set a trailing stop to prevent a 10% loss but the market unexpectedly moves against you by 20%, then the trailing stop doesn’t help you because there won’t have been a chance for your stop to have been triggered and your market order to have been filled near the 10% loss point

Alternate tool to Trailing Stop Loss :

The main alternate tool to a trailing stop-loss order is the trailing stop limit order. Only difference is that, once the stop price is reached, the trade is executed at the limit price you have set or a better price rather than at the then-available market price.

Final words :

In short, a trailing stop-loss is a best and free risk-management tool which helps you to maximize your profits when trading along with reducing the risk of making a big loss. The  trailing stop moves only when the market price moves in your favor thus it’s an effective way to increase unrealized gains, might be small.

Although there are risks and drawbacks involved with using trailing stops, placing it properly can help you in minimizing losses and protecting profits.

Bipartisan Infrastructure Law weighs on BTC price

Bearish trend seem to pin the Crypto King – Bitcoin this week. Bearish trend is favored by the two negative events happened in the past few days.

On Nov. 12, the United States Securities and Exchange Commission (SEC) denied VanEck’s spot Bitcoin ETF request, Upon the rejection the Bitcoin saw a dip but most important than the rejection was the rationale behind the rejection that was to be noted.

The SEC directly mentioned their uncertainties about Tether’s (USDT) stablecoin and the incapacity to deter fraud and market manipulation in Bitcoin trading. Whereas Bloomberg senior ETF analyst and cryptocurrency expert Eric Balchunas had already given only a 1% chance for approval so the rejection was not a big surprise.

On Nov 15, US lawmakers introduced a bipartisan bill that seeks to modify a cryptocurrency tax provision in President Joe Biden’s newly passed infrastructure deal. The bill is intended to modify a section of the law that amends the Internal Revenue. Biden’s infrastructure deal would require anyone who receives more than $10,000 in digital assets to report their personal information to the Internal Revenue Service. This will be mandated in 2024.

Additionally, the government in Norway is considering ways to limit the environmental impact of cryptocurrency mining and may support Swedish proposals to that end, including a European ban on proof-of-work mining. The European Commission has revealed it is already working to promote a transition to “more sustainable” protocols.

Norway Minister Says “Although crypto mining and its underlying technology might represent some possible benefits in the long run, it is difficult to justify the extensive use of renewable energy today.” This also underpins the bearish trend of the bitcoin.

BTC/USD 4 Hour Chart:

Support: 55823.5 (S1), 54065.1 (S2), 51496.9 (S3).

Resistance: 60150.1 (R1), 62718.3 (R2), 64476.7 (R3).

All these negative events underpin the downtrend for the crypto king; we expect a bearish trend for BTC/USD.

Retreat in US Treasury yields impacts USD

The USD/JPY pair is trading sideways in the Asian session today. The yen pair is in consolidating phase after a heavy loss yesterday by dropping the most since August. While it has to be noted that the pair has broke March 2017 highs before activation of the stated fall on Wednesday.

The receding inflation expectation seem to underpin the bearish trend of USD/JPY. The receding inflation expectations could be linked to the recent retreat in the US Treasury yields and the US Dollar Index (DXY). The White House optimism regarding the US supply chain seems to create the receding inflation fears.

Elsewhere, US inflation expectations, as measured by the 10-year breakeven inflation rate as per the St. Louis Federal Reserve (FRED) data, dropped for the second consecutive day by the end of Wednesday’s North American session.

Market sentiments remain challenged amid the Fed policymakers remaining divided on the inflation woes and the rate hike concerns.

Chicago Fed’s Chief Executive Officer Charles L. Evans recently mentioned that “It will take until the middle of next year to complete the Fed’s wind-down of its bond-buying program, even as the central bank remains mindful of inflation.”

U. S Treasury secretary Janet Yellen said that “U. S’s three-decade inflation high was the result of the Covid-19, and it can be controlled only if the pandemic is controlled.” She said “if U. S manages to control the pandemic soon, consumer prices could return to normal levels sometime in the second half of next year.”

On the other hand, Japan’s unlock and aim for stronger ties with the US to stop China from Taiwan favors the Yen. Talks that the Asian nation has been able to achieve the highest inoculation rate in the Group of Seven (G7) without any mandates also seem to be positive for the Yen.

USD/JPY 4 Hour Chart:

Support: 113.70 (S1), 113.30 (S2), 112.66 (S3).

Resistance: 114.74 (R1), 115.37 (R2), 115.78 (R3).

Amidst a lack of any major data, Fed speak will be closely watched by the Yen traders to direct their move further. In the meantime, we expect a bearish trend for USD/JPY.