BTC/USD Weekly Forecast (15th November 2021 – 19th November 2021)

Fundamental view:

Bitcoin showed bullish trend this week. Widespread adoption of the big crypto underpins the bullish trend. One area where the Bitcoin adoption is expanding is municipal asset. Miami and its Mayor Francis Suarez are about to take  Bitcoin adoption to a new level by announcing that every citizen with a digital wallet will earn dividends in BTC.

Elsewhere, Bitwise is  optimistic on the approval of  spot Bitcoin ETF. Matt Hougan, the CIO at investment company, stated. BitWise dropped out of the Bitcoin futures ETF race as it continues to focus on a spot ETF.

As per a recent survey, 16% of Surveyed Americans are Crypto Investors or traders. “Shark Tank” star Kevin O’Leary’s said on a Reddit Talk session Thursday that his cryptocurrency holdings now make up 10% of his portfolio, “ At the beginning of the year, I was at 3% weighting,” he said. “The target was to get 7% by year-end. However, because of the appreciation of so many of the assets I have now, we’re almost at 10% today.”

The major economic events deciding the movement of the pair in the next week are Retail Sales monthly report, Fed Industrial Production monthly report at Nov 16, EIA Crude Oil Stocks Change at Nov 17, Initial Jobless Claims at Nov 18 and Fed Governor Waller Speech at Nov 19 for US.

BTC/USD Weekly outlook:

Technical View:

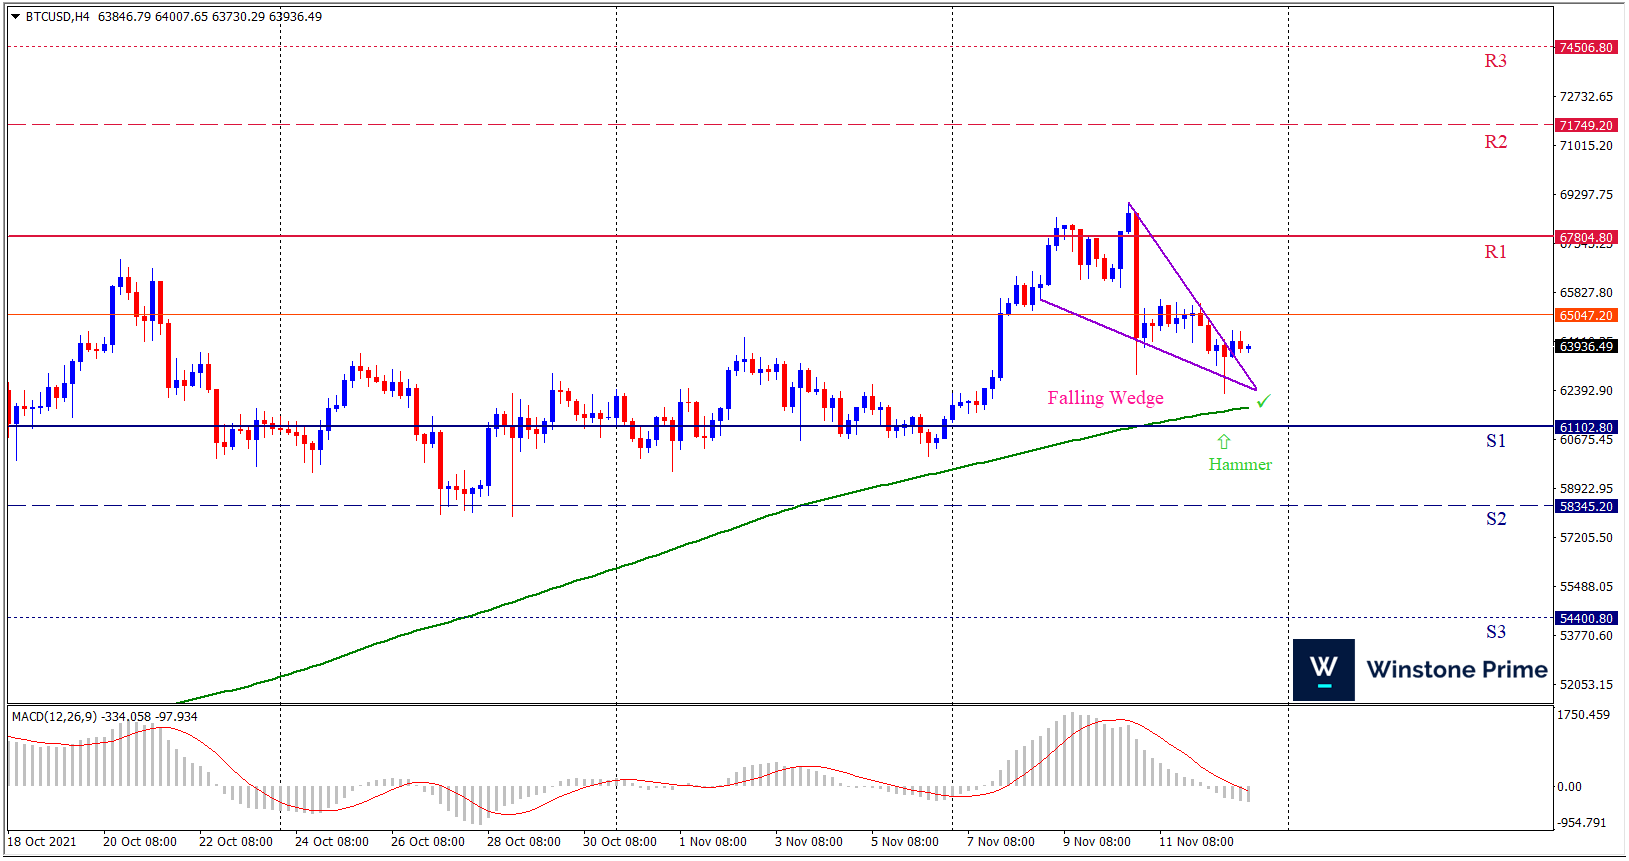
Last week’s high was 6.86% higher than the previous week. Maintaining high at 68991.7 and low at 62289.7 showed a movement of 6702 pips.

In the upcoming week we expect BTC/USD to show a bullish trend. The Instrument is trading above the 200 Simple Moving Average and the MACD trades to the downside. A solid breakout above 67804.8 may open a clean path towards 71749.2 and may take a way up to 74506.8. Should 61102.8 prove to be unreliable support, the BTCUSD may sink downwards 58345.2 and 54400.8 respectively. In H4 chart falling wedge pattern breakout favors prospects of a bullish trend. Hammer pattern constructs a bullish outlook for the pair in the upcoming week.

Preference
Buy: 63760.5 target at 70401.8 and stop loss at 61098.4


Alternate Scenario
Sell: 61098.4 target at 54401.8 and stop loss at 63760.5

XAU/USD Weekly Forecast (15th November 2021 – 19th November 2021)

Fundamental view:

Gold is holding the lower ground against the American dollar just above $1,850 maintaining its consolidative mode. For this week, the pair had rose more than 2%. With data from the US showing that consumer inflation reached its highest level since 1990, XAU/USD rallied and touched its highest level since June – $1,868 on Wednesday. Eventhough gold retreated from that level, it somehow managed to close in the positive territory on Wednesday and Thursday before going into a consolidation phase. Whereas the improving market mood appears to be weighing down on gold price.

Moving on to macroeconomic data, The US Bureau of Labor Statistics reported on Wednesday that annual inflation, as measured by the Consumer Price Index (CPI) had jumped to its highest level since 1990 at 6.2% in October. The Core CPI, which excludes volatile food and energy prices, also climbed to its strongest level in more than three decades at 4.6%. On Friday, the University of Michigan announced that the Consumer Sentiment Index fell to its lowest level since November 2011 at 66.8.       

The major economic events deciding the movement of the pair in the next week are Retail Sales monthly report, Fed Industrial Production monthly report at Nov 16, EIA Crude Oil Stocks Change at Nov 17, Initial Jobless Claims at Nov 18 and Fed Governor Waller Speech at Nov 19 for US.

XAU/USD Weekly outlook:

Technical View:

Last week’s high was 2.70% higher than the previous week. Maintaining high at 1868.7 and low at 1812.2 showed a movement of 565 pips.

In the upcoming week we expect XAU/USD to show a bullish trend. The Instrument is trading above the 200 Simple Moving Average and the MACD trades to the upside. A solid breakout above 1884.6 may open a clean path towards 1904.9 and may take a way up to 1941.1. Should 1828.2 prove to be unreliable support, the XAUUSD may sink downwards 1792.0 and 1771.7 respectively. In H4 chart bullish flag pattern formation favors prospects of a bullish trend. Also to be noted hammer formation exerts the expectation of uptrend for the pair.

Preference
Buy: 1864.3 target at 1915.8 and stop loss at 1823.7


Alternate Scenario
Sell: 1823.7 target at 1772.5 and stop loss at 1864.3

AUD/USD Weekly Forecast (15th November 2021 – 19th November 2021)

Fundamental view:

Australian data showed a uptrend in the beginning of the week later the trend became favorable to the American dollar supported by the Inflation expectation and employment data. Federal Reserve has launched its bond program taper at previous Wednesday’s meeting with a $15 billion reduction in monthly purchases, only November and December were spoken for in the FOMC statement. On the other hand, The RBA will publish the Minutes of its latest meeting on Tuesday, while Governor Philip Lowe will offer a speech.

Australia Employment Change on 11th November and Michigan Consumer Sentiment on 12th November created uptrend whereas US CPI report and Initial Jobless claim Federal Budget Balance on 10th November Favored downtrend for the pair.

The major economic events deciding the movement of the pair in the next week are RBA Governor Lowe Speech, US Retail Sales monthly report, Fed Industrial Production monthly report at Nov 16, Australia Wage Price Index quarterly report, US EIA Crude Oil Stocks Change at Nov 17, Initial Jobless Claims at Nov 18 and Fed Governor Waller Speech at Nov 19.

AUD/USD Weekly outlook:

Technical View:

Last week’s high was 1.40% lower than the previous week. Maintaining high at 0.7431 and low at 0.7276 showed a movement of 155 pips.

In the upcoming week we expect AUD/USD to show a bearish trend.  The currency pair is trading below the 100 Simple Moving Average and the MACD trades to the downside. A firm breakout below 0.7260 may led to the fall of 0.7191 and then may take a way down to 0.7105. Should 0.7415 prove to be unreliable resistance, the AUDUSD may raise upwards to 0.7501 and 0.7570 respectively. In H4 chart symmetrical triangle breakout favors prospects of a bearish trend. Bearish harami formation exerts the expectation of downtrend for the pair.

Preference
Sell: 0.7331 target at 0.7192 and stop loss at 0.7420


Alternate Scenario
Buy: 0.7420 target at 0.7569 and stop loss at 0.7331

USD/JPY Weekly Forecast (15th November 2021 – 19th November 2021)

Fundamental view:

US dollar has rallied against all the majors in this week, It was also noisy against the Japanese yen. Federal Reserve has launched its bond program taper at previous Wednesday’s meeting with a $15 billion reduction in monthly purchases, only November and December were spoken for in the FOMC statement. Elsewhere the governors said they expected the cuts to continue However this decision would turn on progress of the US economy.  On the other hand, Japanese economic information improved though consumer weakness continued. Prime Minister of Japan, Fumio Kishida has promised the standard fiscal spending and monetary stimulus policies and a desire for a weaker yen that have routinely failed to improve the nation’s economic prospects over three decades.

BoJ M2 Money Stock yearly report on 10th November and US JOLTS Job Openings on 12th November favored bearish trend whereas US core CPI monthly report on 10th November and FOMC Member Williams Speech on 12th November favored bullish trend for the pair.

The major economic events deciding the movement of the pair in the next week are Japan Industrial Production monthly report at Nov 15, Japan Tertiary Industry Activity Index monthly report, US Retail Sales monthly report, Fed Industrial Production monthly report at Nov 16, US EIA Crude Oil Stocks Change at Nov 17, Initial Jobless Claims at Nov 18 and Fed Governor Waller Speech at Nov 19.

USD/JPY Weekly outlook:

Technical View:

Last week’s high was 0.12% lower than the previous week. Maintaining high at 114.30 and low at 112.72 showed a movement of 158 pips.

In the upcoming week we expect USD/JPY to show a bullish trend. The currency pair is trading above the 200 Simple Moving Average and the MACD trades to the upside. A solid breakout above 114.54 may open a clean path towards 115.21 and may take a way up to 116.12. Should 112.96 prove to be unreliable support, the USDJPY may sink downwards to 112.05 and 111.38 respectively. In H4 chart, Formation of rounding bottom pattern indicates the reversal of the trend creating prospects of a bullish trend. Hammer formation supports our expectation.

Preference
Buy: 113.86 target at 115.20 and stop loss at 112.91


Alternate Scenario
Sell: 112.91 target at 111.39 and stop loss at 113.86