BTC/USD Weekly Forecast (01st November 2021 – 05th November 2021)

Fundamental view:

Bitcoin has raised above $60000 this week after a fall on oct 27. Bitcoin price got a great help as the SEC began approving Bitcoin ETFs. But the hype seems to have got vanished after leaving BTC high and dry. Whereas MicroStrategy CEO, Michael Saylor took advantage of the recent dips in Q3 as the company accumulated nearly 9,000 BTC in this period. The same trend was seen with El Salvador, the country that made BTC a legal tender.

Moreover, The US regulators are reportedly exploring how the US banks could hold Bitcoin. Federal Deposit Insurance Corporation chairman Jelena McWilliams stated that US bank regulators are working on providing a roadmap for banks to hold crypto assets. Elsewhere, Immersive cooling technology may help with the transition to zero-emission Bitcoin (BTC) mining, Hass McCook, a member of the Bitcoin Mining Council (BMC), told Cointelegraph. Amidst all the catalysts favoring Bitcoin, it potrayed a bullish trend.

The major economic events deciding the movement of the pair in the next week are ISM Manufacturing PMI at Nov 01, ADP Nonfarm Employment Change, ISM Non-Manufacturing PMI, EIA Crude Oil Stocks Change, Fed Interest Rate Decision at Nov 03, Nonfarm Productivity quarterly report at Nov 04 and Nonfarm Payrolls at Nov 05 for US.

BTC/USD Weekly outlook:

Technical View:

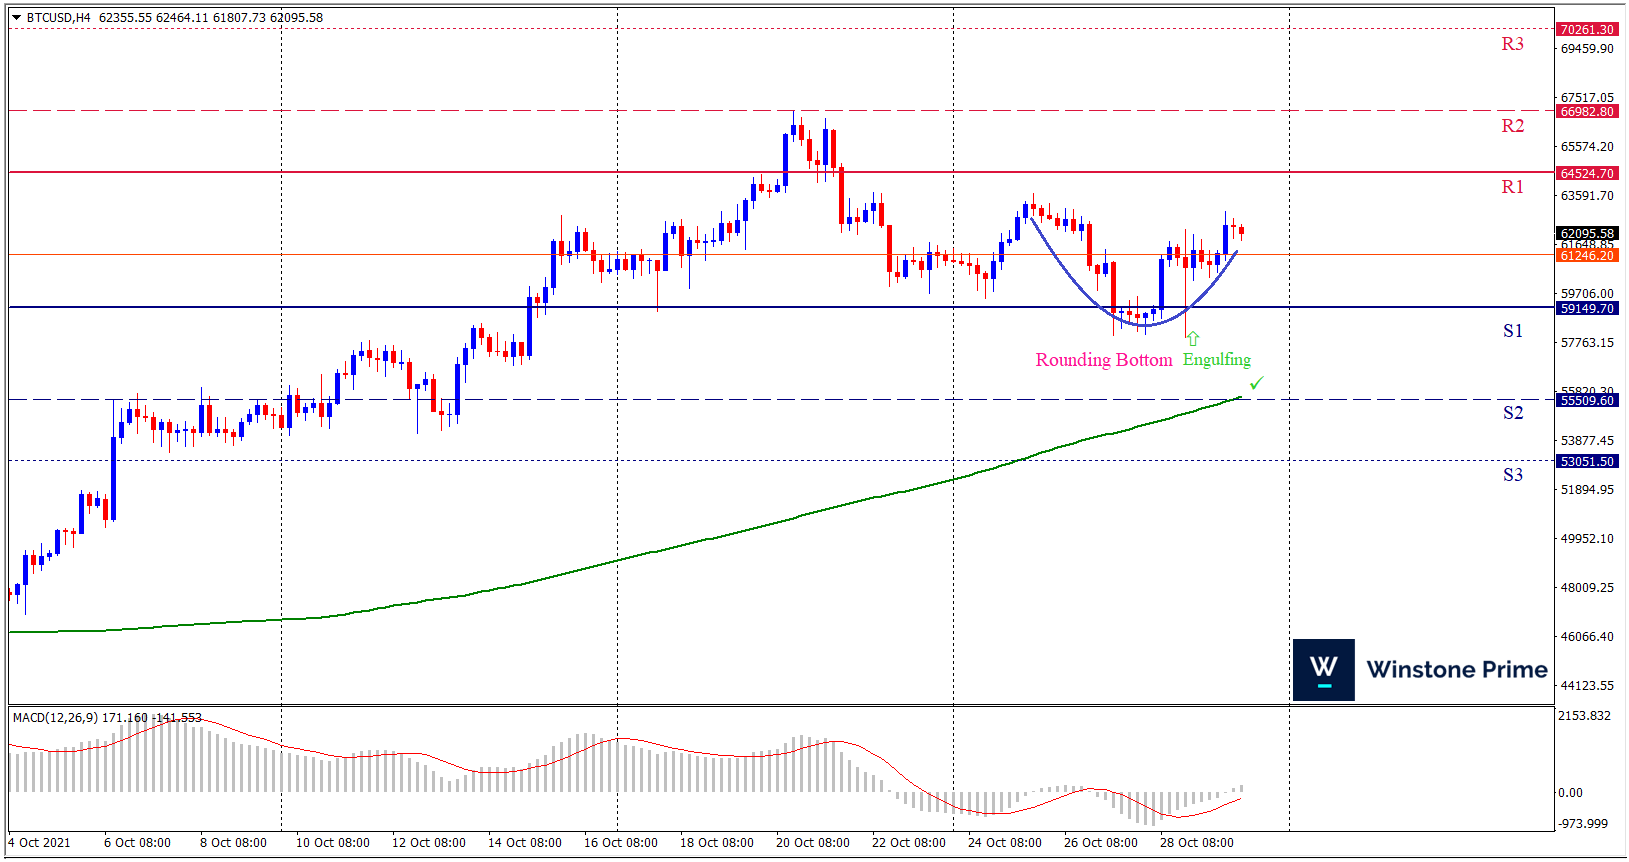
Last week’s high was 5.14% lower than the previous week. Maintaining high at 63704.4 and low at 57967.8 showed a movement of 5737 pips.

In the upcoming week we expect BTC/USD to show a bullish trend. The Instrument is trading above the 200 Simple Moving Average and the MACD trades to the upside. A solid breakout above 64524.7 may open a clean path towards 66982.8 and may take a way up to 70261.3. Should 58788.1 prove to be unreliable support, the BTCUSD may sink downwards 55509.6 and 53051.5 respectively. In H4 chart rounding bottom pattern favors prospects of a bullish trend. Bullish engulfing pattern further constructs a bullish outlook for the pair in the upcoming week.

Preference
Buy: 61895.2 target at 66981.8 and stop loss at 59144.7


Alternate Scenario
Sell: 59144.7 target at 53959.5 and stop loss at 61895.2

XAU/USD Weekly Forecast (01st November 2021 – 05th November 2021)

Fundamental view:

Gold markets have rallied significantly during the course of the week but have given back all the gains on Friday. The downside pressure was exerted by a stronger dollar after U.S. data showing inflation stayed hot last month and the market has put the focus back on the Federal Reserve’s policy meeting next week. The consumer spending data fueled worries about aggressive monetary policy action from the Fed to combat a surge in prices, sending yields the U.S. 10-year higher.

This week, sour sentiment challenged the commodity’s upside momentum. The same took clues from an absence of a deal on US President Joe Biden’s $1.75 trillion stimulus package. Recently, US House Speaker Nancy Pelosi conveyed her optimism towards the passage of infrastructure and social spending, climate bills during the phone call to postpone the vote on the infrastructure bill. The continuous rise in inflationary pressures comes along with signs of a global economic slowdown and fueled worries about the risk of stagflation. This, in turn, tempered investors appetite for perceived riskier assets. Upcoming FOMC meeting will the next driver of the bullion market.           

The major economic events deciding the movement of the pair in the next week are ISM Manufacturing PMI at Nov 01, ADP Nonfarm Employment Change, ISM Non-Manufacturing PMI, EIA Crude Oil Stocks Change, Fed Interest Rate Decision at Nov 03, Nonfarm Productivity quarterly report at Nov 04 and Nonfarm Payrolls at Nov 05 for US.

XAU/USD Weekly outlook:

Technical View:

Last week’s high was 0.18% lower than the previous week. Maintaining high at 1810.4 and low at 1771.8 showed a movement of 386 pips.

In the upcoming week we expect XAU/USD to show a bullish trend. The Instrument is trading above the 200 Simple Moving Average and the MACD trades to the downside. A solid breakout above 1804.9 may open a clean path towards 1827.0 and may take a way up to 1843.5. Should 1766.3 prove to be unreliable support, the XAUUSD may sink downwards 1749.8 and 1727.7 respectively. In H4 chart bullish bat pattern favors prospects of a bullish trend. Also to be noted Bullish harami formation exerts the expectation of uptrend for the pair.

Preference
Buy: 1789.8 target at 1826.4 and stop loss at 1761.3


Alternate Scenario
Sell: 1761.3 target at 1728.7 and stop loss at 1789.8

AUD/USD Weekly Forecast (01st November 2021 – 05th November 2021)

Fundamental view:

The AUD/USD pair advanced against the greenback for a fifth consecutive week. The pair reached the high of 0.7555 on Thursday, following the release of US growth-related figures. The US central bank is about to have a monetary policy meeting next week and make an announcement of the outcome on Wednesday, November 3. Back in September, chief Jerome Powell anticipated that they could begin a gradual tapering process at their next summit, with the Minutes of the meeting indicating the central bank would probably start by cutting $10 billion a month in Treasuries and $5 billion a month in mortgage-backed securities. On the other hand , Australian inflation unexpectedly soared in the third quarter of the year.

Australia Import Price Index quarterly report on 27th October and Michigan 5-Year Inflation Expectations on 29th October favored bearish outlook for the pair whereas US Goods Trade Balance on 27th October and US Pending Home Sales monthly report on 28th October framed bullish outlook for the pair.

The major economic events deciding the movement of the pair in the next week are US ISM Manufacturing PMI at Nov 01, RBA Interest Rate Decision at Nov 02, US ADP Nonfarm Employment Change, Fed Interest Rate Decision at Nov 03, US Nonfarm Productivity quarterly report at Nov 04, RBA Monetary Policy Statement and US Nonfarm Payrolls at Nov 05.

AUD/USD Weekly outlook:

Technical View:

Last week’s high was 0.13% higher than the previous week. Maintaining high at 0.7555 and low at 0.7463 showed a movement of 92 pips.

In the upcoming week we expect AUD/USD to show a bearish trend.  The currency pair is trading above the 100 Simple Moving Average and the MACD trades to the upside. A firm breakout below 0.7469 may fall to 0.7420 and may take a way down to 0.7377. Should 0.7561 prove to be unreliable resistance, the AUDUSD may raise upwards 0.7604 and 0.7653 respectively. In H4 chart bearish shark pattern favors prospects of a bullish trend. Also to be noted Bearish engulfing formation exerts the expectation of downtrend for the pair.

Preference
Sell: 0.7509 target at 0.7421 and stop loss at 0.7566


Alternate Scenario
Buy: 0.7566 target at 0.7652 and stop loss at 0.7509

USD/JPY Weekly Forecast (01st November 2021 – 05th November 2021)

Fundamental view:

US dollar has rallied a bit against the Japanese yen during the trading course of the week. The credit goes to the dovish Bank of Japan statement. Markets have reacted to the Fed restriction but the amount and timing of the purchase reduction is uncertain. Treasury yields in the US have spiked while Japanese Government Bond (JGB) rates have been stagnant. As expected, the Bank of Japan (BOJ) kept its ultra-loose monetary policy in place, with its main rate remaining at -0.1%, where it has been since 2016. 

The  policy statement noted that “Downward pressure stemming from Covid-19 is likely to remain on service, consumption, and exports and production are expected to decelerate temporarily due to supply-side constraints.”

Dallas Fed Services Business Activity on 29th October and BoJ Interest Rate Decision on 28th October framed bearish outlook whereas Japan Coincident Index on 25th October and US Core Durable Goods Orders monthly report on 27th October framed bullish outlook for the pair.

The major economic events deciding the movement of the pair in the next week are BoJ Monetary Policy Meeting Minutes, US ISM Manufacturing PMI at Nov 01, US ADP Nonfarm Employment Change, Fed Interest Rate Decision at Nov 03, Japan Markit Services PMI, US Nonfarm Productivity quarterly report at Nov 04 and US Nonfarm Payrolls at Nov 05.

USD/JPY Weekly outlook:

Technical View:

Last week’s high was 0.34% lower than the previous week. Maintaining high at 114.31 and low at 113.25 showed a movement of 106 pips.

In the upcoming week we expect USD/JPY to show a bullish trend. The currency pair is trading above the 100 Simple Moving Average and the MACD trades to the nearly neutral. A solid breakout above 114.46 may open a clean path towards 114.92 and may take a way up to 115.52. Should 113.40 prove to be unreliable support, the USDJPY may sink downwards 112.80 and 112.34 respectively. In H4 chart, Formation of symmetrical triangle breakout indicates reversal of the trend creats prospects of a bullish trend Along with a bullish harami formation braces our expectation.

Preference
Buy: 114.01 target at 114.91 and stop loss at 113.35


Alternate Scenario
Sell: 113.35 target at 112.36 and stop loss at 114.01