GBP/USD Weekly Forecast (01st November 2021 – 05th November 2021)

Fundamental view:

The British pound has gone back and forth against the greenback during the course of the week. Long term US government bond yields showed decline last week. The benchmark on the 10-year Treasury note fell to 1.51%, while that on the 2-year bond has surged above 0.50%. A narrowing spread usually hints at a rate-hiking cycle but also suggests slowing economic growth. This gap between near-term and long-term bond yields is not only seen in the US but also similar in Germany, the UK, Canada and Australia, particularly when comparing 5-year and 30-year bond yields. The US Federal Reserve will have meeting next week, announcing the outcome on Wednesday, November 3.

BoE MPC Member Tenreyro Speech on 25th October and Britian 5-Year Treasury Gilt Auction on 26th October framed bullish trend whereas CB Consumer Confidence Index on 26th October and  Baker Hughes US Oil Rig Counton 29th October framed bearish trend for the pair.

The major economic events deciding the movement of the pair in the next week are UK Markit/CIPS Manufacturing PMI, US ISM Manufacturing PMI at Nov 01, US ADP Nonfarm Employment Change, Fed Interest Rate Decision at Nov 03, BoE Interest Rate Decision, US Nonfarm Productivity quarterly report at Nov 04 and US Nonfarm Payrolls at Nov 05.

GBP/USD Weekly outlook:

Technical View:

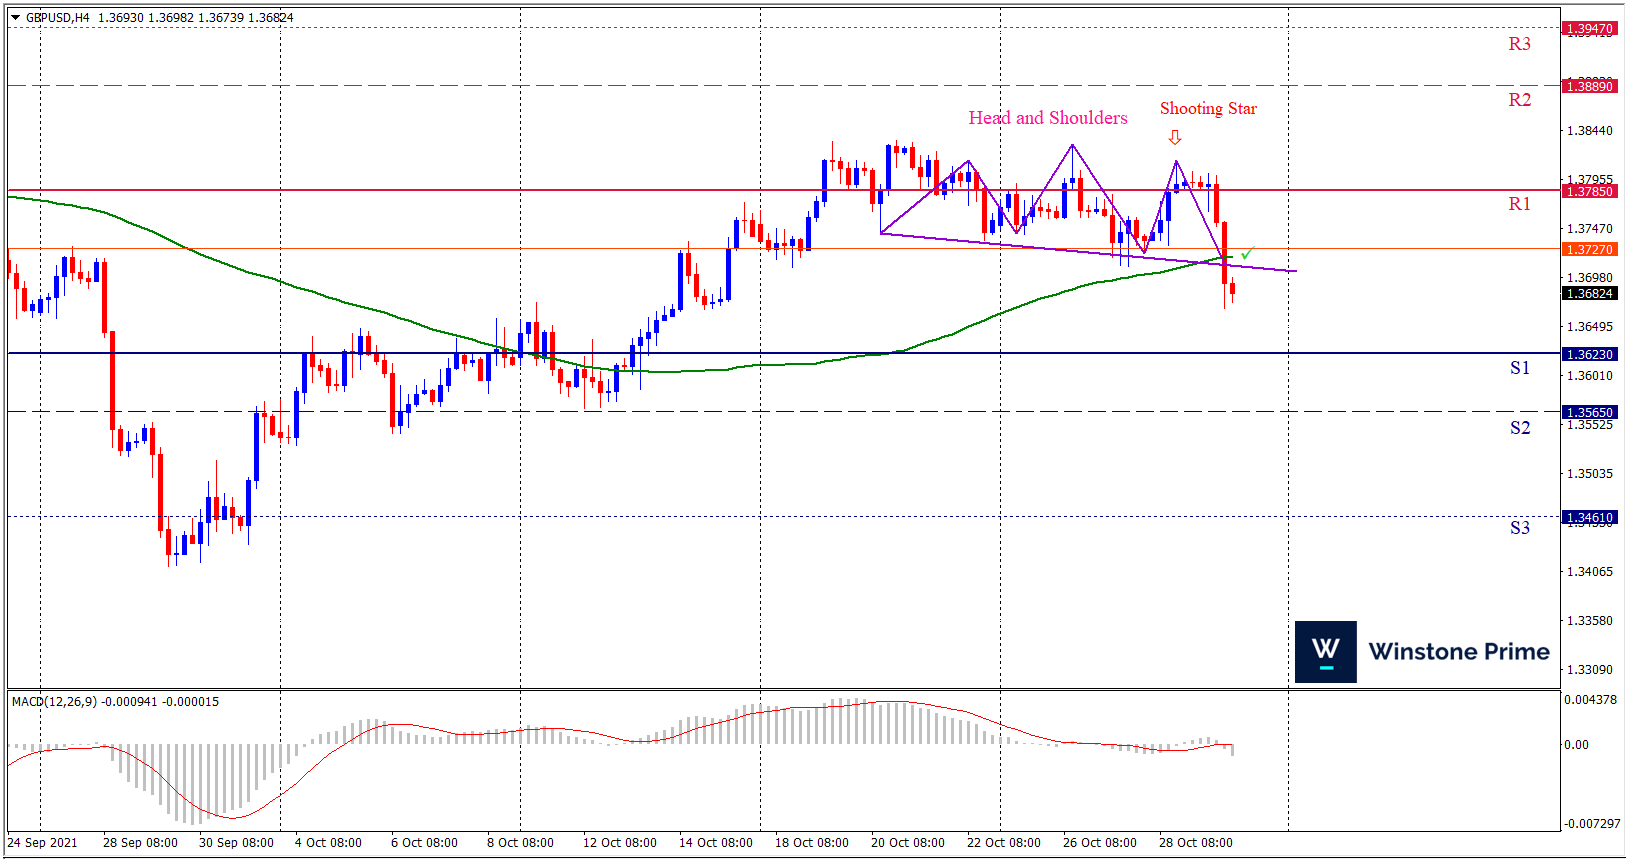
Last week’s high was 0.03% lower than the previous week. Maintaining high at 1.3830 and low at 1.3668 showed a movement of 162 pips.

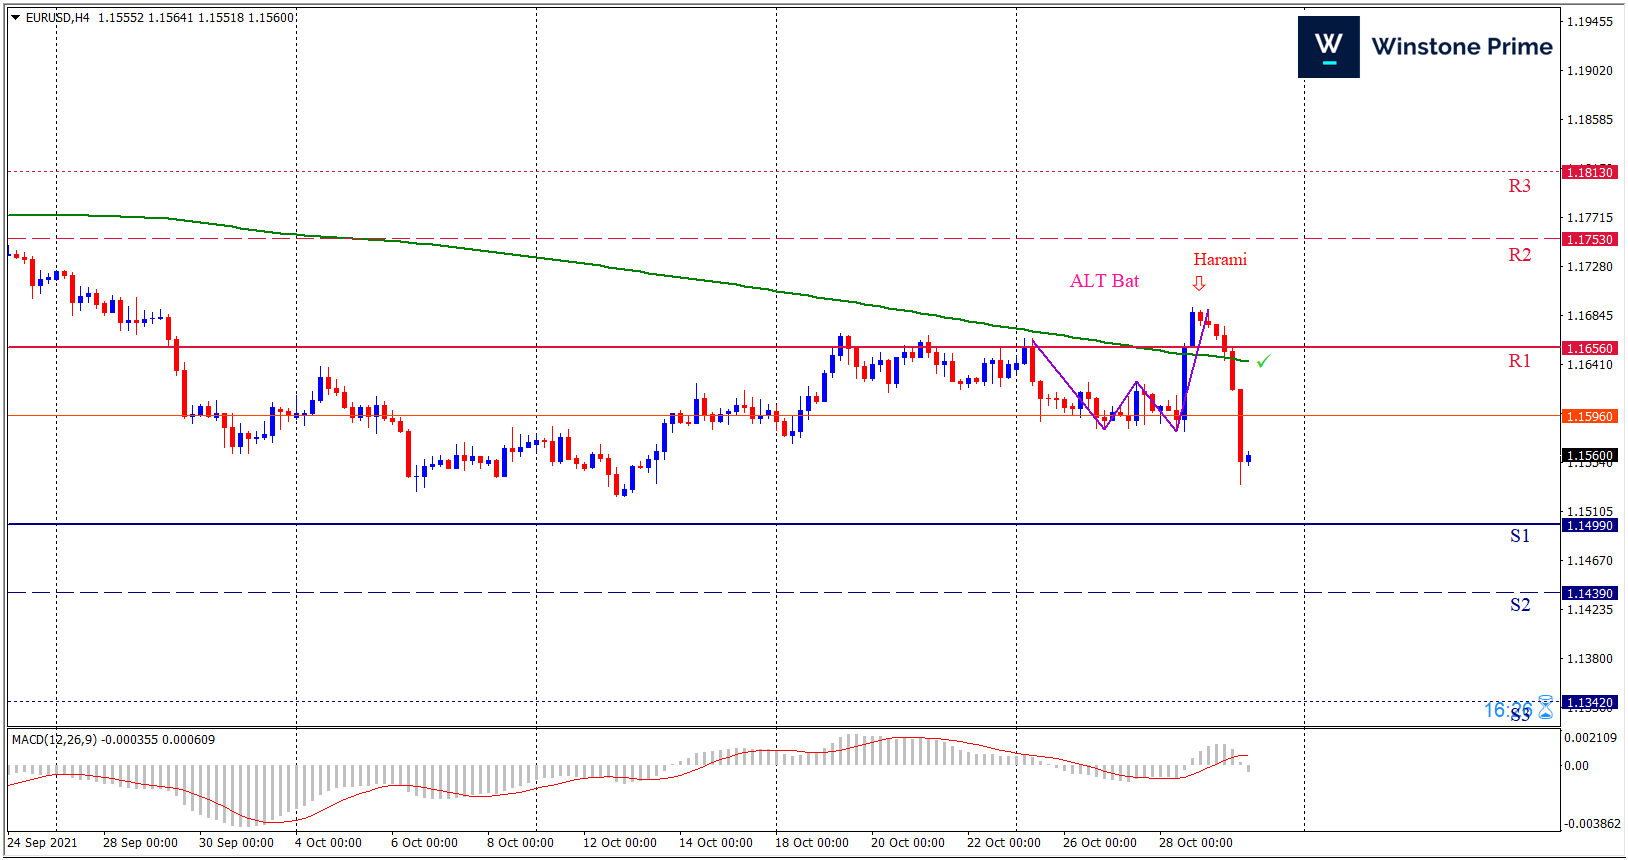
In the upcoming week we expect GBP/USD to show a bearish trend. The currency pair is trading below the 100 Simple Moving Average and the MACD trades to the downside. A firm breakout below 1.3623 may fall to 1.3565 and may take a way down to 1.3461. Should 1.3785 prove to be unreliable resistance, the GBPUSD may raise upwards 1.3889 and 1.3947 respectively. Chart formation of head and shoulders pattern in H4 chart creates prospects of a bearish trend. Shooting star pattern formation braces expectation for a bearish trend.

Preference
Sell: 1.3682 target at 1.3536 and stop loss at 1.3790


Alternate Scenario
Buy: 1.3790 target at 1.3946 and stop loss at 1.3682

EUR/USD Weekly Forecast (01st November 2021 – 05th November 2021)

Fundamental view:

The Euro has initially tried to rally during the course of the trading week but later gave up gains and ended with a bearish candle. The Central banks are facing inflationary pressures amid post-pandemic supply chain issues and soaring energy prices, And at the same time economic recoveries are losing momentum. As Tighter monetary policies could be double edge sword, Global policymakers have tried hard to down talk regarding inflation but all at vain. The ECB had its meeting in this week, while the US Federal Reserve will do so next week, announcing the outcome on Wednesday, November 3. The European Central Bank left its monetary policy unchanged as anticipated, and the statement was quite similar to the previous statement.

Europe PPI yearly report on 26th October and ECB Interest Rate Decision on 28th October favored bullish trend for the pair whereas US New Home Sales on 26th October and Michigan Consumer Expectations on 29th October favored bearish trend for the pair.

The major economic events deciding the movement of the pair in the next week are US ISM Manufacturing PMI at Nov 01, Europe Government Budget Balance, US ADP Nonfarm Employment Change, Fed Interest Rate Decision at Nov 03, US Nonfarm Productivity quarterly report at Nov 04, Europe Retail Sales monthly report and US Nonfarm Payrolls at Nov 05.

EUR/USD Weekly outlook:

Technical View:

Last week’s high was 0.20% higher than the previous week. Maintaining high at 1.1692 and low at 1.1535 showed a movement of 157 pips.

In the upcoming week we expect EUR/USD to show a bearish trend. The currency pair is trading below the 200 Simple Moving Average and the MACD trades to the downside. A firm breakout below 1.1499 may fall to 1.1439 and may take a way down to 1.1342. Should 1.1656 prove to be unreliable resistance, the EURUSD may raise upwards 1.1753 and 1.1813 respectively. Chart formation of a Bearish ALT Bat pattern in H4 chart sets prospects for a bearish trend. Bearish harami formation in H4 chart further escalates the expectation for a bearish trend.

Preference
Sell: 1.1561 target at 1.1405 and stop loss at 1.1661


Alternate Scenario
Buy: 1.1661 target at 1.1812 and stop loss at 1.1561

Relationship Between Swiss Franc and Gold

Most of the world’s gold is refined in Switzerland and gold accounts for around 20% of Swiss exports. This close relationship to gold means that the CHF moves quite closely with gold. It is not a secret on the Forex market that the Swiss Franc is highly correlated with the gold price. In fact, according to CNBC, the leading investment bank in the United States, Goldman Sachs went as far as to say that CHF might become a gold proxy. Gold is to Switzerland, what wine is to the French. Yet, if we go for deeper analysis, we can discover that there are at least two major factors that link the gold prices with the exchange rates of the Swiss franc. Let us go through each of those in more detail.

Swiss National Bank and Gold

There is strong positive sentiment toward gold in Switzerland. The Swiss people abandoned the gold standard in May 2000. Until that year, the Swiss franc had to be backed by a minimum of 40 percent in gold reserves. Switzerland remains the world’s gold hub. Most of the gold produced in the world transits physically through this country, where four of the world’s major refineries are located.

Reason behind why there is always a relationship with Gold

Switzerland’s currency Swiss franc has a strong relationship with gold.   Both the Swiss franc (CHF) and gold bullion acted as reserve ‘currencies’ thereby establishing a relationship between the price of gold and the Swiss franc. Despite some differences, the Swiss franc and the price of gold are related and the similarities between the two can be clearly identified. 

The first factor connecting these two major variables (Swiss franc and gold prices) is the huge amount of gold reserves. The Swiss National Bank, or SNB, is one of the world’s largest gold reserves. This comes after the government passed a law requiring the Swiss franc to be supported by gold. The new law was voted on after the country decided to sell some shares of gold. Although SNB has sold most of its gold reserves, the Bank holds about 10% of the Swiss francs in circulation with gold.

The second influential factor is the safe location enjoyed by the Swiss banking system. This is what has affected the positive relationship between the Swiss franc and gold prices. Gold reserves are said to act as a barrier to inflation, and for this reason, it is not surprising that Switzerland has faced very low inflation. Switzerland has been able to maintain its consumer price index at 0.5% for 25 years, with price levels in Switzerland remaining unchanged for 10 to 12 years beginning in 2008. The SNB tried to stimulate inflation or reduce the value of the CHF by lowering interest rates but the move did not yield any positive results. It was so motivated to bring about a change in the inflation rate that the bank sought to introduce a negative interest rate of -0.75%. This, too, proved ineffective. Thus Switzerland chose to operate at 0% interest rate. Switzerland is benefiting from gold prices as the custodian of higher gold reserves, revealing a positive relationship between the Swiss franc and gold prices.

The Swiss National Bank (SNB) has one of the largest gold reserves in the world. The latest reports suggest that SNB holds more than 1,000 tonnes of gold in its possession. In fact, before 2000 the country was in a gold standard when it was required by law that CHF had to be backed by this precious metal. This rule was eventually dropped after the referendum in 2000. This, in turn, allowed the Swiss National Bank to sell some of its gold holdings to invest those sums in other assets. However, despite those sales, SNB still retains a large number of precious metals in its reserves. In fact, some financial commentators even argue that if Switzerland were to reinstate the gold standard, SNB will be able to back at least 10% of Swiss Francs in circulation by its precious metal holdings.

As a result, when the gold price rises, the reserves of the Swiss National Bank gain more buying power and Swiss franc becomes more attractive to investors and currency traders. In order to better illustrate this relationship, let us take a closer look at this daily gold price chart:

As we can see from the image above, the XAU/USD has made some seesaw gains during the last 17 months of trading, rising from $1,454 to $2074 and trading now on above $1,778 level. This means that in this period the gold price in US dollar terms has raised more. Here the obvious question is: how did the Swiss franc respond to those developments? In order to answer this question, let us check this daily EUR/CHF chart:

As we can see from the above diagram, since spring 2019 the Swiss Franc has steadily appreciated against the Euro, with EUR/CHF falling from 1.0280 and reached the high 1.1507 and trading at 1.0715 on October 2021. During early June 2021 the pair tried to reverse course and break above the downward trend. However, after making some initial gains, the Euro lost momentum, with EUR/CHF giving up most of its recent gains and falling back. So as we can see from this example, there were instances where the Swiss franc has made some serious gains, benefiting from the rise of gold price.

Across the seven seas, Switzerland‘s currency, the Swiss franc, also has a strong link with gold. Using the dollar as base currency, the USD/CHF usually climbs when the price of gold slides. Conversely, the pair dips when the price of gold goes up. The precious metal gold is always positive correlated with CHF as more than 25% of Switzerland’s money is in gold reserves.

Gold has a negative correlation with USD/CHF. When gold goes up, USD/CHF goes down. When gold goes down, USD/CHF goes up.

Conclusion

The Swiss National Bank having large gold reserves is the main reason for the high degree of the positive correlation between CHF and the price of this precious metal. There is strong positive sentiment toward gold in Switzerland. As we can see, despite their obvious differences, gold and Swiss Franc do share some similarities. CHF has proven to be better at holding on to its purchasing power, than nearly all of the fiat currencies in the world. This led to long term appreciation of the currency against its peers. Therefore, the Swiss franc can be a very attractive investment for those investors who are more interested in preserving their purchasing power, rather than hunting for high yields. So this is why CHF is highly correlated with gold prices. Open account and explore this opportunity.

Markets bet on rate hike favors Aussie

The Australian dollar is trading high against the US dollar today as investors bet that interest rates could rise as soon as April, hammering bonds and sending yields soaring to peaks not seen since 2019.

The central bank declined to purchase the April 2024 target bond, even though the yield was much higher than the bank’s target of 0.10%. The bond market responded by sending the yield up to 0.50%. This gave the indication that the RBA has abandoned its yield target and thus fueled market bets that the central bank will raise the cash rate ahead of its plan to raise rates only in 2024. The markets have now priced in a hike of 50 basis points by mid-2022 and 100 basis points by the end of 2022.

The Reserve Bank of Australia holds a policy meeting on November 2nd and it will be quite interesting to see what the bank does to cover today’s drama. Will policy makers acknowledge that the rates are unlikely to remain at 0.1% until 2024? Will the bank make any changes to its yield curve policy? Inflation is another area that the markets will be looking for some guidance at next week’s meeting.

Ben Jarman, a rate strategist at JPMorgan said “This is a very significant surprise,” “Silence is a strong signal and next week it seems the RBA will formally drop YCC entirely.”

“It had already looked likely that the calendar guidance – first hike expected in 2024 – would go, as it had been tenuous for a while, so that is likely to be removed entirely too.” As a result, Jarman now expected a first hike in the 0.1% cash rate to come in the fourth quarter of next year, instead of late 2023 as previously forecasted.

Elsewhere, Australia Retail Sales has not only snapped a three-month downtrend but made a rise of past +0.2% forecast to +1.3%, versus -1.7% prior, during September. Additionally, the Producer Price Index (PPI) data for the third quarter (Q3) also jumped above +0.3% market consensus and +0.7% prior readings to +1.1%. Further, the YoY figures rose to 2.9% versus 3.2% expected and 2.2% previous readouts.

On the other hand, the absence of deal on US President Joe Biden’s $1.75 trillion stimulus package weighs on the market sentiment. Recently, US House Speaker Nancy Pelosi conveyed her optimism towards the passage of both infrastructure and social spending, climate bills during the phone call to postpone the vote on the infrastructure bill.

AUD/USD 4 Hour Chart:

Support: 0.7495 (S1), 0.7449 (S2), 0.7419 (S3).

Resistance: 0.7571 (R1), 0.7601 (R2), 0.7646 (R3).

The RBA’s move and Retail sales data favors Aussie over greenback. We expect a bullish trend for AUD/USD.