AUD/USD Weekly Forecast (25th October 2021 – 29th October 2021)

Fundamental view:

Aussie went back and forth against the greenback during the trading course of the week.  Firmer gold prices played a supportive role, as the bright metal soared this week. The dismal Chinese data undermined demand for high-yielding assets which benefited American currency. But the market’s mood reversed by the US Q3 earnings reports. Upbeat results sent Wall Street to record highs and undermined demand for the greenback, despite rising US government bond yields. The Reserve Bank of Australia released the Minutes of its latest meeting, although there was nothing to see there. The document was just like a replica of the September statement, showing that policymakers are confident about the economic recovery but reiterated that a rate hike is unlikely until at least 2024.

US Existing Home Sales monthly report on 21st Oct and US Markit Services PMI on 22nd Oct created bearish trend whereas US Fed Industrial Production yearly report on 18th Oct and US EIA Cushing Crude Oil Stocks Change on 20th Oct created bullish trend for the pair.

The major economic events deciding the movement of the pair in the next week are US CB Consumer Confidence Index at Oct 26, RBA Weighted Median CPI quarterly report, US Core Durable Goods Orders monthly report at Oct 27, US GDP quarterly report, US Initial Jobless Claims at Oct 28, Australia Retail Sales monthly report and US Michigan Consumer Sentiment at Oct 29.

AUD/USD Weekly outlook:

Technical View:

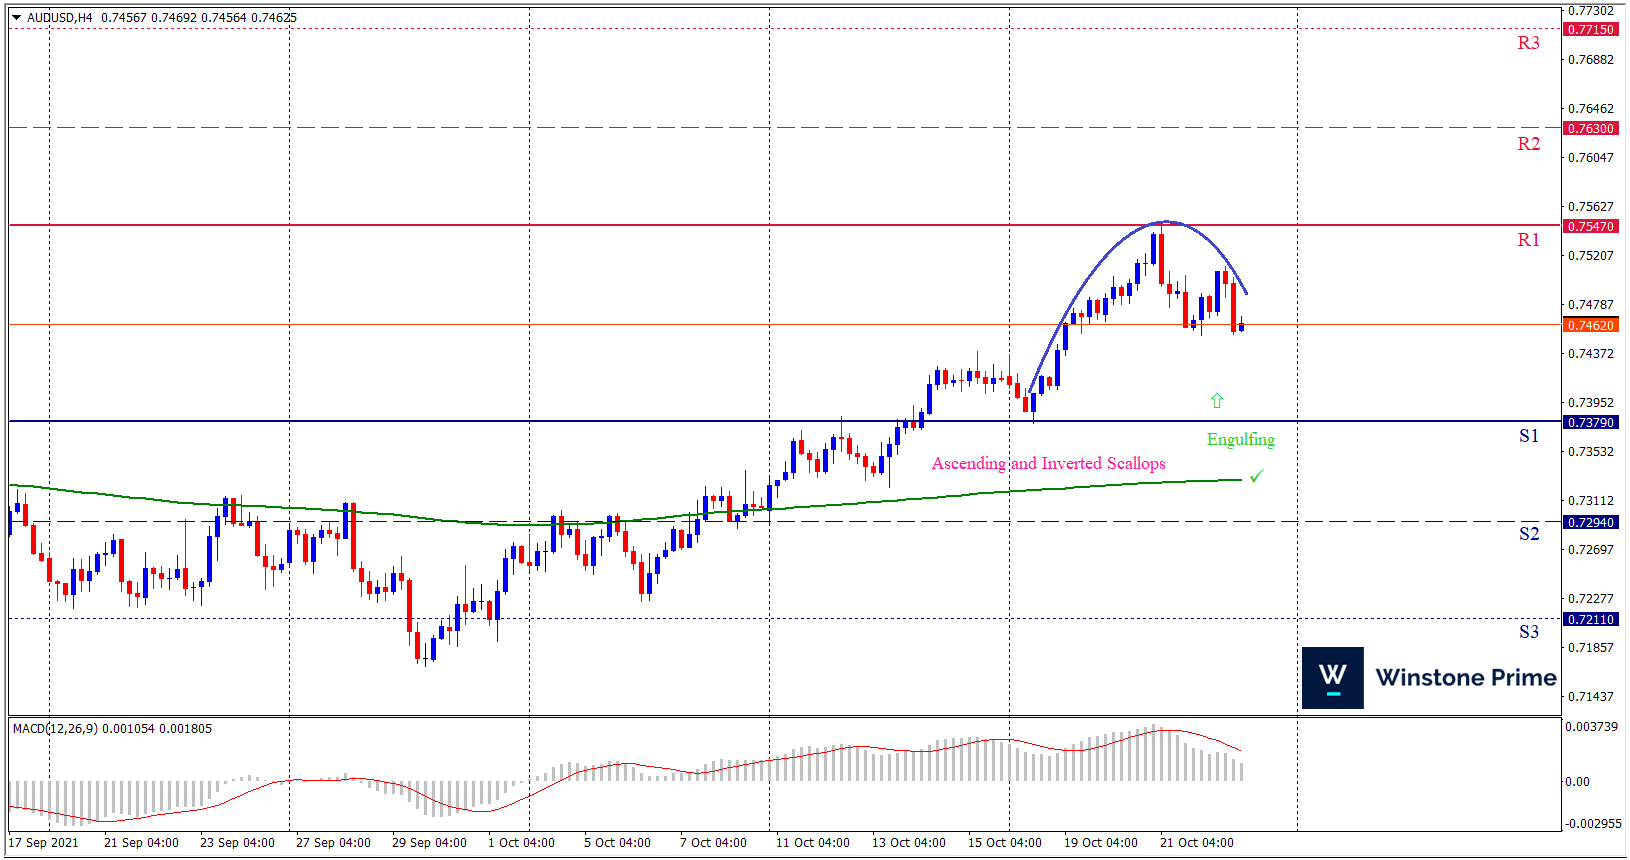
Last week’s high was 1.42% higher than the previous week. Maintaining high at 0.7546 and low at 0.7378 showed a movement of 168 pips.

In the upcoming week we expect AUD/USD to show a bullish trend.  The currency pair is trading above the 200 Simple Moving Average and the MACD trades to the upside. A solid breakout above 0.7547 may open a clean path towards 0.7630 and may take a way up to 0.7715. Should 0.7379 prove to be unreliable support, the AUDUSD may sink downwards 0.7294 and 0.7211 respectively. In H4 chart ascending and inverted scallops pattern favors prospects of a bullish trend. Also to be noted Bullish engulfing formation exerts the expectation of uptrend for the pair.

Preference
Buy: 0.7465 target at 0.7629 and stop loss at 0.7374


Alternate Scenario
Sell: 0.7374 target at 0.7212 and stop loss at 0.7465

USD/JPY Weekly Forecast (25th October 2021 – 29th October 2021)

Fundamental view:

US dollar has lost its ground against the Japanese yen in this week. In Japan, National election on October 31 is almost guaranteed to return the Liberal Democratic Party (LDP) candidate, current Prime Minister Fumio Kishida, to office. He has promised new fiscal and monetary stimulus programs to revive the Japanese economy. On the other hand, The Federal Reserve is also moving toward raising rates – but that is likely only in the summer of 2022, according to bond markets.

Japan Trade Balance on 20th Oct and Japan Core CPI yearly report on 22nd Oct created bullish trend whereas US Fed Industrial Production yearly report on 18th Oct and US Markit Manufacturing PMI on 22nd Oct created bearish trend for the pair.

The major economic events deciding the movement of the pair in the next week are US CB Consumer Confidence Index at Oct 26, Japan Retail Sales monthly report, US Core Durable Goods Orders monthly report at Oct 27, BoJ Interest Rate Decision, US GDP quarterly report, US Initial Jobless Claims at Oct 28 and US Michigan Consumer Sentiment at Oct 29.

USD/JPY Weekly outlook:

Technical View:

Last week’s high was 0.17% higher than the previous week. Maintaining high at 114.70 and low at 113.41 showed a movement of 129 pips.

In the upcoming week we expect USD/JPY to show a bearish trend. The currency pair is trading below the 50 Simple Moving Average and the MACD trades to the downside. A firm breakout below 113.03 may fall to 112.58 and may take a way down to 111.74. Should 114.32 prove to be unreliable resistance, the USDJPY may raise upwards 115.16 and 115.61 respectively.  In H4 chart, Formation of rounding top pattern indicates reversal of the trend creating prospects of a bearish trend Along with a dark cloud formation braces our expectation.

Preference
Sell: 113.48 target at 112.35 and stop loss at 114.37


Alternate Scenario
Buy: 114.37 target at 115.60 and stop loss at 113.48

GBP/USD Weekly Forecast (25th October 2021 – 29th October 2021)

Fundamental view:

The British pound went back and forth against the US dollar in this week. The pound received the help from Bank of England Governor Andrew Bailey, who said he is ready to act against rising inflation. His words have contrasted that of other central bankers that have mostly stuck with the say that increasing prices are only “transitory”. On the other hand, The Federal Reserve is also moving toward raising rates – but that is likely only in the summer of 2022, according to bond markets. In Britian, coronavirus has unfortunately made a way to center-stage. Cases, hospitalizations and also deaths are on the rise, raising fears of new lockdowns.

US Building Permits on 19th Oct and US EIA Crude Oil Stocks Change on 20th Oct created bullish trend whereas Britain CPI monthly report on 20th Oct and Britain Public Sector Net Cash Requirement on 21st Oct created bearish trend for the pair.

The major economic events deciding the movement of the pair in the next week are US CB Consumer Confidence Index at Oct 26, UK Nationwide HPI yearly report, US Core Durable Goods Orders monthly report at Oct 27, US GDP quarterly report, US Initial Jobless Claims at Oct 28, BoE Consumer Credit monthly report and US Michigan Consumer Sentiment at Oct 29.

GBP/USD Weekly outlook:

Technical View:

Last week’s high was 0.44% higher than the previous week. Maintaining high at 1.3834 and low at 1.3709 showed a movement of 125 pips.

In the upcoming week we expect GBP/USD to show a bullish trend. The currency pair is trading above the 200 Simple Moving Average and the MACD trades to the upside. A solid breakout above 1.3824 may open a clean path towards 1.3891 and may take a way up to 1.3949. Should 1.3699 prove to be unreliable support, the GBPUSD may sink downwards 1.3641 and 1.3574 respectively. Chart formation of bullish butterfly pattern in H4 chart favors prospects of a bullish trend. Bullish engulfing pattern formation escalates the expectation for a bullish trend.

Preference
Buy: 1.3767 target at 1.3889 and stop loss at 1.3694


Alternate Scenario
Sell: 1.3694 target at 1.3569 and stop loss at 1.3767

EUR/USD Weekly Forecast (25th October 2021 – 29th October 2021)

Fundamental view:

The Euro managed to close with a bullish candle for a second consecutive week but the advance was somewhat dull as the shared currency stood away from investors’ radars. Top Federal Reserve officials expressed concerns about extended high inflation and noted that it could force the central bank to raise rates sooner than anticipated. Fed Governor Christopher Waller said that he thinks that rate increases are “still some time off” despite thinking the central bank should begin tapering its bond-buying program before year-end. At the current point, it is a “done deal” that the Federal Reserve will start reducing its facilities as soon as November, regardless of when it decides to hike rates. Amidst the above catalyst , Euro enjoyed a bullish outlook.

US TIC Net Long-Term Transactions on 18th Oct and US Existing Home Sales on 21st Oct created bearish trend whereas Europe CPI excl. Tobacco monthly report on 20th Oct and Europe Markit Services PMI on 22nd Oct created bullish trend for the pair.

The major economic events deciding the movement of the pair in the next week are Europe Ifo Business Climate at Oct 25, US CB Consumer Confidence Index at Oct 26, US Core Durable Goods Orders monthly report at Oct 27, ECB Interest Rate Decision, ECB Monetary Policy Press Conference, US GDP quarterly report at Oct 28 and Europe GDP quarterly report and US Michigan Consumer Sentiment at Oct 29.

EUR/USD Weekly outlook:

Technical View:

Last week’s high was 0.39% higher than the previous week. Maintaining high at 1.1669 and low at 1.1571 showed a movement of 98 pips.

In the upcoming week we expect EUR/USD to show a bullish trend. The currency pair is trading above the 100 Simple Moving Average and the MACD trades to the upside. A solid breakout above 1.1683 may open a clean path towards 1.1725 and may take a way up to 1.1781. Should 1.1585 prove to be unreliable support, the EURUSD may sink downwards 1.1529 and 1.1487 respectively. Chart formation of a bullish bat pattern in H4 chart sets prospects for a bullish trend. Hammer formation in H4 chart escalates the expectation for a bullish trend.

Preference
Buy: 1.1641 target at 1.1724 and stop loss at 1.1580


Alternate Scenario
Sell: 1.1580 target at 1.1488 and stop loss at 1.1641