What happens in Recession?

Recession can be defined as the contraction of a business or economic cycle when a general decline in economic activity lasts for months or even years and it also a significant decline in general economic activity in a particular region. During recession economy experiences the negative gross domestic product (GDP), rising levels of unemployment, falling retail sales and contracting measures of income and manufacturing for an extended period of time. It can affect natural business and economic cycle of expansion and contraction. Although an economy can show signs of weakening months before a recession begins, the process of determining whether a country is in a true recession may not often take time. A recession is short, but its impact can be long-lasting.

In this article we will look in depth what exactly is a recession, how does it start, and what typically happens in recession?

What causes recession?

There are many reasons for the occurrence of recession. Some of the recessions are merged with sharp changes in prices, which lead to a steep fall in private and public sector spending. It usually takes place when a decline in confidence, a feeling among businesses and consumers that time will not be as good as it used to be.

Leading indicators such as reduced working hours, lower new orders of capital and consumer goods and lower building permits will all trigger a recession. An economy begins to expand in its tank (weak point) and begins to regress after reaching its peak (high point). A deep recession that lasts for a long time will eventually turn into depression.

The recent recession COVID-19 recession is the global economic recession caused by the COVID-19 pandemic, which began in February 2020, is the worst global economic crisis since the Great depression 1930. Stock markets and consumer activity stagnated after a year of global recession, with the Covid-19 lockdowns and other precautions taken in early 2020 pushing the global economy into crisis. Within seven months, every advanced economy had fallen into recession or depression, while all emerging economies were in recession. World Bank modeling suggests that in some regions the recovery will not be achieved until 2025 or beyond.

  • A financial crisis – If banks have a shortage of liquidity, they reduce lending and reduces investment.
  • High Interest rates – Interest rates limits the liquidity money that’s available to invest when they rise. While hiking interest rates increases the cost of borrowing and reduces demand. For Example: While recession, the Fed has often raised interest rates to protect the value of the dollar. 
  • Fall in asset prices – A sudden loss of confidence in investing can create a subsequent bear market, draining capital out of businesses. Negative wealth effect leads to less spending.
  • Fall in real wages and Consumer Confidence – The real preferences of consumers, savers, and investors place limits on how far such an artificially stimulated boom can proceed. These manifest as real economic constraints on continued growth, in the form of labor market shortages, supply chain bottlenecks, and spikes in commodity prices (which lead to inflation) when not enough real resources can be made available to support all the over stimulated business investment plans based on easy-money policies. Once these set in, a rash of business failures begins in the face of increased production costs and the economy tips into recession. 
  • Excess inflation and deflation Inflation is the steady, upward trend in prices over time. Inflation isn’t a bad thing per se, but excessive inflation is a dangerous phenomenon. While runaway inflation can create a recession, deflation can be even worse. Deflation is when prices decline over time, which causes wages to contract, which further depresses prices. When a deflationary feedback loop gets out of hand, people and business stop spending, which undermines the economy. Central banks and economists have few tools to fix the underlying problems that cause deflation. Example: Japan’s struggles with deflation throughout most of the 1990s caused a severe recession.
  • Trade war During a recession asset prices typically plummet. The markets can be volatile with asset prices experiencing wild swings. Investors react quickly to any hint of news either good or bad and the flight to safety can cause some investors to pull their money out of the assets entirely.

Recessions versus Depressions

Economists estimate that there have been 33 recessions in the United States since 1854. Since the 1980s, there have been four periods of negative economic growth that are considered recessions. Well-known examples of the recession include the 2008 financial crisis and the global recession in the wake of the Great Depression of the 1930s. Depression is a deep and chronic depression. 

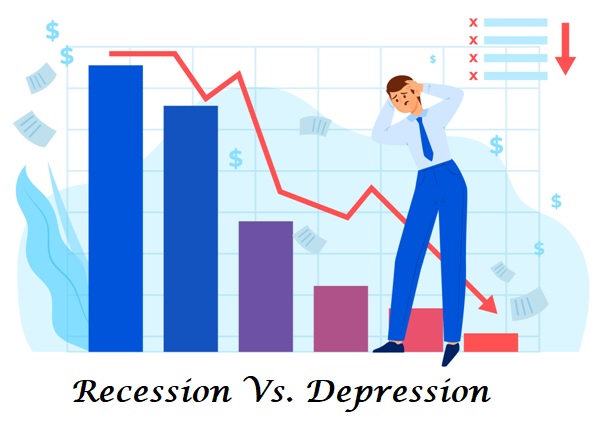
While there are no specific criteria for declaring depression, the distinctive features of the Great Recession are that GDP fell more than 10% and the unemployment rate briefly touched 25%. Ideally, a depression is a severe decline that lasts for years.

The economic recession can be disaster for any country. This will lead to the closure of many companies, increase the unemployment rate and slow economic growth. But even when an economy is in recession, people do not have integrated views. The central bank should consider the implications of implementing monetary policy. It should take into account both the promotion of economic growth and the control of inflation. Sometimes economy forecasting is uncertain, predicting future recessions is far from easy. For example recent recession COVID-19 appeared seemingly out of nowhere in early 2020, and within a few months the U.S. economy had been all closed down and millions of workers had lost their jobs. The NBER has officially declared a U.S. recession due to coronavirus, noting that the U.S. economy fell into contraction starting in February 2020.

Some people believe that the recession is the best time to start a new business. As unemployment rises, labor becomes cheaper, and for those who can afford it, money may be available. Depression is a severe recession, the duration of which is usually measured in years rather than months. Depression can also involve the breakdown of a key part of the economy, especially the financial system.

Non farm payroll report pressurizes dollar

The Euro pair has extended its progress in the European session today. The major currency pair is fighting for new traces after falling for three days while the previous day, do not forget that the pair reached its lowest consolidation phase in 15 months. The current resolution among EUR / USD traders may be linked to the recent resurgence of the US dollar, in the midst of a volatile mood, as opposed to the suspicion of Fed tapping and the absence of bond traders. The US dollar index (DXY) also consolidated its Friday losses.

Traders from the United States may have seen some temporary relief as senators raised the debt ceiling in early December. Meanwhile non-farm payrolls increases for non-agricultural wage earners have become more complex as the unemployment rate has fallen. It may have opened the door to Fed policy tapping in November. For the upcoming week September US CPI print will be the key. Elevated price pressures could open the door to a central bank around capital. FOMC meeting minutes is also at focus. Meanwhile, the earnings period begins with the reporting of major US banks, including the Bank of America and Citigroup.

On Friday, Markets were disappointed with the headline of Non-Farm Payrolls (NFP) markets with 194K figures, much lower than around 500K expected. It should be noted, however, that the previous reading received an upward correction of 366K. On the other hand unemployment rate fell to 4.8%, 5.1% expected and 5.2% earlier, easing pain, while average hourly earnings exceeded 0.4%, correcting previous readings from 0.4% to 0.6%.

With regard to the lighter calendar and the US holiday, risk triggers are important ahead of Wednesday’s inflation data from Germany on Wednesday and the recent monetary policy meeting of the US and Federal Open Market Committee (FOMC). Previous day, the greenback gauge was weighed by the US job report for September. Challenging the quote may be the latest fears for US economic growth. However, it also joins the geopolitical fear of keeping central bank buyers confident. Alternatively, disappointment from the US Nonfarm Payrolls combats favorable Unemployment Rate and Average Earnings to confuse traders.

The ambiguity on the board of the European Central Bank (ECB) along with the performance of the US dollar, is compounded by fears of policymakers’ refusal to weigh EUR/USD prices on the central bank’s next move. The ZEW index is the only indication of the German economic sentiment coming up on Tuesday, towards the economic data to be released in Tuesday. Also on the calendar are the final figures for German inflation in September and Eurozone industrial production for August-Wednesday and Eurozone trade data for August-Friday will entertain the traders.

EUR/USD 4 Hour Chart:

Support: 1.1547 (S1), 1.1522 (S2), 1.1503 (S3).

Resistance: 1.1592 (R1), 1.1611 (R2), 1.1636 (R3).

Amidst these above catalysts the Euro seems on uptrend against greenback. We expect a bullish trend for EUR/USD.

BTC/USD Weekly Forecast (11th October 2021 – 15th October 2021)

Fundamental view:

Bitcoin showed a uptrend against the greenback during the course of the week. Bitcoin adoption in 2021 has been increasing. From increased usage of BTC in El Salvador to rising BTC ATM installations and thus  the future for Bitcoin looks bright. The adoption began with retail sector already, institutions have also started taking a look at BTC. A note shared by JPMorgan to its clients on October 7 revealed that these institutions are looking at BTC as a hedge against inflation instead of gold. CryptoQuant CEO Ki Young Ju tweeted that an investor(s) purchased “$1.6B worth $BTC via market orders in just 5 minutes.”

Elsewhere, The Biden administration is weighing an executive order on cryptocurrencies as part of an effort to set up a government-wide approach to the white-hot asset class, according to people familiar with the matter. The proposed directive would charge federal agencies to study and offer recommendations on relevant areas of crypto touching on financial regulation, economic innovation and national security.

On the other hand, U.S. jobs rose by 194,000 in September, well below economists’ average estimate for a gain of 500,000 jobs, the Labor Department reported Friday. But the data was mixed, with August’s jobs number revised upward by 131,000.The combination may give the U.S. Federal Reserve more flexibility after Chair Jerome Powell signaled recently that the central bank looked to be on track to start tapering its $120 billion-a-month in bond purchases a form of monetary stimulus later this year. Amidst all the catalysts the Bitcoin posted gains against the US dollar.

The major economic events deciding the movement of the pair in the next week are JOLTS Job Openings at Oct 12, FOMC Minutes at Oct 13, Initial Jobless Claims, EIA Crude Oil Stocks Change at Oct 14 and Retail Sales monthly report at Oct 15 for US.

BTC/USD Weekly outlook:

Technical View:

Last week’s high was 12.08 % higher than the previous week. Maintaining high at 55960.3 and low at 46918.7 showed a movement of 9042 pips.

In the upcoming week we expect BTC/USD to show a bullish trend. The Instrument is trading above the 200 Simple Moving Average and the MACD trades to the upside. A solid breakout above 57615.0 may open a clean path towards 61308.5 and may take a way up to 66656.6. Should 48573.4 prove to be unreliable support, the BTCUSD may sink downwards 43225.3 and 39531.8 respectively. In H4 chart ascending scallops pattern favors prospects of a bullish trend. Bullish harami pattern constructs a bullish outlook for the pair in the upcoming week.

Preference
Buy: 53863.9 target at 61307.5 and stop loss at 48568.4


Alternate Scenario
Sell: 48568.4 target at 39532.8 and stop loss at 53863.9

XAU/USD Weekly Forecast (11th October 2021 – 15th October 2021)

Fundamental view:

Gold moved up and down against the greenback during the course of the week. The risk-averse market environment at the beginning of the week extended a helping hand to the precious metal. On Monday, The only data from the US showed that Factory Orders increased by 1.2% on a monthly basis in August but this reading received no market reaction. The US Senate passed the bill to raise the debt ceiling by $408 billion through November and easing concerns over a possible default. Moreover, Russian President Vladimir Putin said that they will be ramping up gas output to ease the pressure on energy prices in Europe and provided an additional boost to risk sentiment.

The  US Economy has reported that Nonfarm Payrolls (NFP) rose by 194,000 in September. This reading is far less than the expectation of 500,000 and triggered a USD selloff. However, the underlying details of the publication revealed that August’s print got revised higher to 366,000 from 235,000 and the Unemployment Rate declined to 4.8% from 5.2%. But the yellow metal failed to take the advantage of that.              

The major economic events deciding the movement of the pair in the next week are JOLTS Job Openings at Oct 12, FOMC Minutes at Oct 13, Initial Jobless Claims, EIA Crude Oil Stocks Change at Oct 14 and Retail Sales monthly report at Oct 15 for US.

XAU/USD Weekly outlook:

Technical View:

Last week’s high was 0.95% higher than the previous week. Maintaining high at 1781.3 and low at 1745.7 showed a movement of 356 pips.

In the upcoming week we expect XAU/USD to show a bullish trend.  The Instrument is trading above the 100 Simple Moving Average and the MACD trades to the upside. A solid breakout above 1776.8 may open a clean path towards 1796.9 and may take a way up to 1812.4. Should 1741.2 prove to be unreliable support, the XAUUSD may sink downwards to 1725.7 and 1705.6 respectively. In H4 chart bullish shark pattern favors prospects of a bullish trend. And Bullish engulfing formation exerts the expectation of uptrend for the pair.

Preference
Buy: 1762.3 target at 1795.4 and stop loss at 1736.7


Alternate Scenario
Sell: 1736.7 target at 1706.6 and stop loss at 1762.3