Expectation on US job data favors greenback

The pound is struggling today against greenback due to heightened nerves about the global growth outlook and as trader’s awaited U.S. jobs data for a clue on the timing of Federal Reserve policy tightening. Investors are investing in greenback due to raising concerns about the central bank and higher inflation in November. Traders are keen on Washington’s talks to raise the US debt ceiling to avoid the government’s first instalment. The pound has pushed a weaker tone as investors have turned their attention away from fuel shortages and supply chain restrictions in the UK to expectations that the Bank of England could become the UK’s first major central bank to hike rates after the COVID-19 crisis.

British military personnel in combat fatigues arrived on Monday at a BP (BP.L) storage depot after the government ordered the army to help deliver fuel to tackle an acute shortage of truckers, a Reuters reporter said. Britain’s supply chains for everything from pork, petrol and poultry to medicines and milk have been strained to breaking point by shortages of labour in the wake of the Brexit and COVID crises. Panic buying of fuel amid the shortage of truckers triggered chaotic scenes across major cities last week with queues of drivers stacked up. Some have had fist fights over the pumps while others hoarded fuel in old water bottles. Energy and other prices are rising, stirring fears of inflation, even as a bonus provided to many welfare recipients during the coronavirus pandemic is being withdrawn, and a furlough system that supported workers sent home is ending.

Same time France President Emmanuel Macron plotted with European Union chiefs to halt the export of jabs to Britain earlier this year.  Recently it was reported that a huge batch of the Oxford/AstraZeneca vaccine which had been expected to arrive in the UK was instead diverted from Holland at the last minute. France ‘stole’ almost five million coronavirus vaccine doses which had been destined for Britain. The UK’s relations with France and Brussels hit a low in March when the domestic vaccine roll-out tore ahead of the EU’s.

On the other hand, as the Greenback is a safe haven, traders were on the lookout ahead of the weekend key payrolls report. Analysts said moves in the FX market would be largely stalled by the weekend as investors waited for a revival in the U.S. labor market, which could help the central bank provide hints as to whether it will begin its asset purchases by the end of the year. According to Reuters, non-farm pay data on Friday are expected to show continued improvement in the labor market, adding 488,000 jobs in September.

The pound is struggling despite encouraging economic data. September members’ UK services sector performance rose to 55.4 from an initial estimate of 54.6. However, the prices in this sector have shown huge records. For now, traders are focusing on the UK construction PMI and US ADP employment shift to gauge market sentiment. And Friday Non-Farm payroll data will entertain the trader.

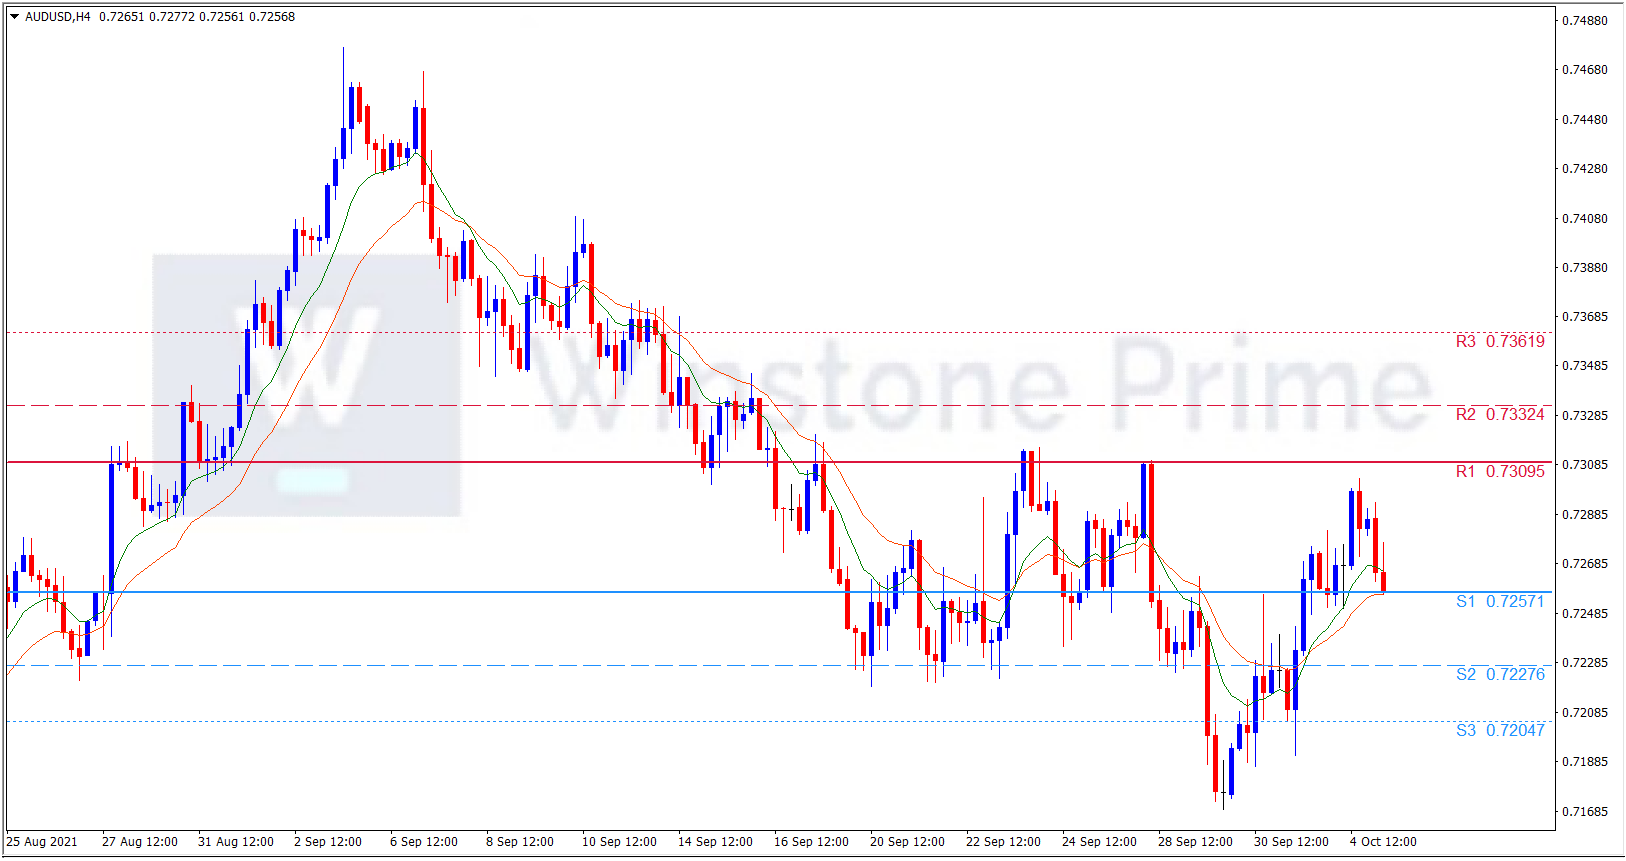
GBP/USD 4 Hour Chart:

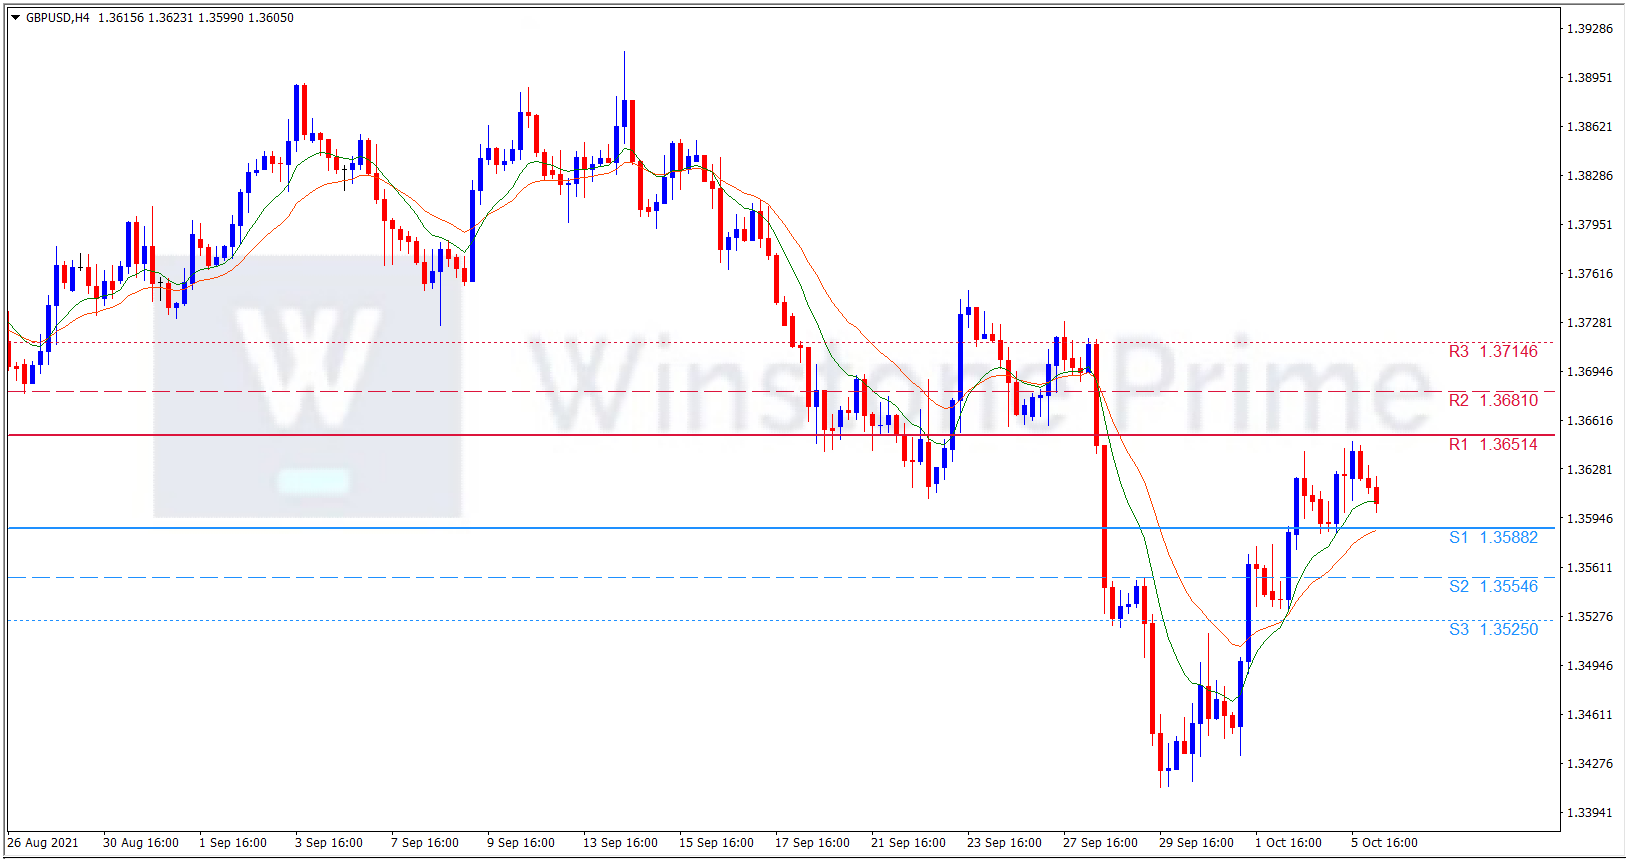
Support: 1.3588 (S1), 1.3555 (S2), 1.3525 (S3).

Resistance: 1.3651 (R1), 1.3681 (R2), 1.3715 (R3).

All of the above catalysts makes the pound to trade downside amidst the UK’s fuel crisis and US Jobs data expectations. We expect a bearish trend for GBP/USD.

RBA monetary policy pressurizes Aussie

Aussie traded low against the greenback today as a reaction to the Reserve Bank of Australia (RBA) monetary policy announcement on early Tuesday. At their October monetary policy meeting, the Reserve Bank of Australia (RBA) board members decided to keep the official cash rate (OCR) unchanged at a record low of 0.10%.The board has decided to maintain the target of 10 basis points for the April 2024 Australian government bond and the board also made a decision to continue to purchase government securities at the rate of $4 billion a week until at least mid-February 2022.

The previous day, Australia’s trade reserves showed improvement in August but imports and exports had declined in the particular month. Figures from the Australian Bureau of Statistics out on Tuesday showed the surplus on international trade jumped to A$15.1 billion ($11.0 billion) in August, from A$12.7 billion the month before. That was the highest on record and confounded analysts’ forecasts of a drop to A$10.3 billion. Exports climbed 4.1% in the month to A$48.5 billion led by LNG, hard coking coal and thermal coal, courtesy of strong energy demand in Asia. Both prices and volumes were higher, eclipsing a sharp fall in prices for iron ore, Australia’s number one export earner.

Imports were down 1.5% to $ 33.4 billion in August, mainly on the back of a fall in capital goods and higher imports of cars. The trade in services is halfway through the pre-pandemic stages, with Australia’s international borders still closed to tourists and students. ABS said it would stop reporting statistics from January, while looking for ways to improve statistics due to problems with obtaining reliable data on services. The downside was ANZ job advertising for September, which was lower than the previous and market forecast -2.7%. Aside from the RBA’s cautious optimism and mixed data previously released in Asia, the AUD/USD market is likely to be depressed due to the risk of sluggish pressure.

Meanwhile, Australia is increasing its vaccination rates, with Sydney and Melbourne, its largest cities and the capital Canberra enduring a week-long lockdown against the highly contagious delta variant. The national first-dose rate for adults exceeded 80% on Tuesday morning. AUD/USD traders will follow short-term direction for the above risk catalysts. Amidst this, China and US politics should be the focus. In addition, the final reading of the US ISM Manufacturing PMI and the Markit PMI for September is important to watch for further moment.

AUD/USD 4 Hour Chart:

Support: 0.7257 (S1), 0.7228 (S2), 0.7205 (S3).

Resistance: 0.7310 (R1), 0.7332 (R2), 0.7362 (R3).

All the above catalysts puts the Aussie in downtrend, ahead of RBA interest rate decision and declining in exports and imports. We expect a bearish trend for AUD/USD.

Understanding Holy Grail Trading System

Do you have a wonderful trading system, one that consistently makes you money? In trading and investment most beginners tend to believe there is a great secret that will bring them success. Thus, begins that search for The great secret (Holy Grail).

You probably believe that you have found your holy grail but this couldn’t be further from the truth. Your system has very little to do with consistent profitability in the markets. Here we categorized the few things that should be considered before choosing a Holy Grail System.

Why Holy Grail

We often hear amateur investors talk about  the “best way” or “only way” to invest and argue, why their way is better than everyone else’s. The passion and energy exuded by these novice investors is wonderful but they are missing the point completely. Each investor develops a system that is suited to their own personal character traits and they use a vehicle (Forex, stocks, options, commodities and CFD’s etc,..) that can help them reach their goals.

Investors also debate systems within a market such as: trend trading, swing trading, scalping, shorting, day trading, buy and hold, fundamental trading, technical trading, Elliot wave theory, moving average crossovers, etc… They all work if the “person” understands the holy grail of trading. And that is being able to understand YOU and how your mind works.

However, it is not the system that makes one successful. It is YOU that makes the system work properly. What does it mean? Each individual must master their own personal psychological impacts on their trading results. You must work on YOU to become consistently successful!

What is Holy Grail System

A trading system that is considered The Holy Grail should be able to produce profitable trades in any market environment or at least the trading strategy should work over 85% of the time.  Trading is a skill that is either learned from experience, or is paid for and used by retail traders from another source. The Holy Grail is the meaning of a full-proof trading system that works.

A simple fact of Forex trading is that it is a game of probabilities, those traders who learn to view and think about trade setups in terms of risk to reward, are the ones who usually end up making consistent money in the Forex market. However, it is possible to make consistent money even if your discretionary trade setup identification skills are not fully matured yet.

Risk to reward setups are what give all traders an equal chance at making consistent money, a thorough understanding of risk to reward and how to view trade setups in terms of possible risk to possible reward, is the closest thing to the “holy grail” of trading, and is one of the most important pieces of the puzzle to consistently profitable trading, second only to having the proper amount of self-discipline and emotional control.

RISK/REWARD Ratio

When trading within the financial markets, there is always a degree of risk. It is a good idea, therefore, for investors to calculate the amount of risk along with potential profits before placing a trade, which is known as the resulting ‘risk/reward ratio’.

This ratio approximates the reward that an investor may earn against the risk that they are willing to invest. It is presented in price form; for example, a risk/reward ratio of 1:5 means that an investor will risk $1 for the potential earning of $5. This is known as the expected return. Calculating risk/reward ratios is an important aspect of risk management, especially when trading in volatile markets, when the prospect of risk is much higher than the potential earnings.

How to place a Risk/Reward Level

The first thing that all traders should do upon spotting a price action setup, or any trade setup, is calculate the risk they will have to take on in order to give the setup a realistic chance at working out. Traders often make one or two mistakes when it comes to determining risk; they either define the reward first, which is a mistake born out of greed, or they put a stop loss on the setup that is much too close to the entry to give the trade a chance at working out.

When learning to think in probabilities and to view the market in terms of risk to reward, it is necessary to calculate the risk on a trade setup first, then you can calculate the reward as a multiple of the amount you have at risk. By concentrating on the risk first, instead of the reward, you are making yourself more aware of the risk involved on each trade setup, instead of becoming fixated on how big of a reward you might make, as many traders do. This will also turn you into a “risk manager”, rather than a “trader”, the best traders in the world know that consistent trading profits come as a result of managing risk effectively, so consider yourself a manager of risk from now on.

The next thing to do after you have identified a high-quality trade setup and marked the risk level on your chart, is to mark the reward levels as multiples of your risk. You want to draw a line at 1 times your risk, 2 times your risk, and 3 times your risk. These are the reward levels you will mainly concern yourself with, should you choose to employ a trailing stop you can use these 1, 2, and 3 times risk levels to begin the trailing process. This setup will give help to reach your Goal setups.

Almost every successful investor realized the lesson of the Holy Grail metaphor-that success in the markets comes from internal control. This is a radical change for most investors. Internal control is not that difficult to achieve, but it is difficult for most people to realize how important it is. Anyone can spend a few minutes to get good results on a single asset in a single timeframe under a single set of market condition, and that leads us to the subject of developing a robust system. In order to be robust, it must meet all the following criteria: getting a real world system to work” is insanely difficult….But following the below steps can help you to reach it.

  • It should be perform in all Currencies, Commodities, Indices and CFD’s.
  • Must perform well in multiple time frames.
  • Must perform well in all market conditions.
  • It’s simple enough to create a system that back tests to show gains. It would take about 10 minutes to test. Instantly difficult, possibly but definitely not easy.


While the results are good, we work every day to make them even better, while at the same time testing new ideas that are completely different from our existing systems.

  • It all starts with an idea. It might derive from your personal trading, or an idea from a blog, or taking an existing system and making it better.
  • The next step is turning your ideas into rules, and the key is to have a platform such as Mt4 and MT5 platforms or a long list of other platforms that give you the basic tools to build a system and to test it and which does all the data handing for you so you can focus on just one thing translating your ideas into a trading system.
  • But then comes the testing. And it is far beyond just seeing if your idea is profitable it must also be robust, and consider draw downs, win/loss ratios, and frequency of trades. Most importantly it has to fit your personal style. If you can’t suffer ten losers in a row, then a system that has lots of small losses with a few home runs isn’t going to work for you.
  • There is no grading on the curve here it is a PASS/FAIL for every test you do. If it fails by any of the criteria you have established right up front, then move on to the next idea. If it passes, then we MIGHT have the beginnings of a trading system that COULD be robust.


While creating a robust trading system you have to pointed out the how to turn an idea into a set of rules; how to decide which parameters we should test; how to avoid curve fitting; what to look for in a test; how to use stops/targets to improve a system, and many more things that will get you ready to take on the insanely difficult world of trading systems. 

Conclusion

The “Holy Grail” is not some magical source that is the key to the markets, as most people believe. To unlock the “Holy Grail,” you need to appreciate your own ability to think and be unique. People make money by finding themselves, achieving their potential, and getting in tune with themselves so that they can follow the flow of the market. Getting in tune with yourself means finding an inner peace inside. It means finding a balance between profits and losses. The Holy Grail is not a magical trading system; it is an inner struggle. Once you’ve discovered that, and resolved the struggle, you can find a trading system that will work for you.

Last week Upbeat EU data favors Euro

Today market session is favoring the Euro pair as well as U.S. labour data this week. The major pair cheered from the upbeat EU data and risk-on mood triggered the prior corrective pullback. However, a shift in the market sentiment seems to have recently weighed on the quote amid a quiet start to the key week.  The dollar found support just below last week’s peaks on Monday as renewed concerns about China’s property sector and looming U.S. labour data put investors in a cautious mood. European markets is looking to start the month after a tricky September, with concerns around inflation, where Federal Reserve tapering and rising interest rates dominated sentiment.

The risk aversion wave takes clues from China as Evergrande shares get suspended from trading in Hong Kong. However, news that an investor will acquire a 51% stake in the troubled firm’s management unit test the bears amid a week-long vacation in China. Shares in embattled developer China Evergrande 3333.HK were halted in Hong Kong without any immediate reason, rekindling market nerves about the possibility of global contagion – or at least distress in China’s property sector. Trading in the shares of Evergrande Property Services was also halted. There were no reasons given for the trading halts.

At the same time, the shares of another Chinese property developer Hopson were also suspended. Events of interest, however, include a meeting of euro zone finance ministers on Monday to discuss matters including the EU’s recovery plans, banking union and fiscal policy. Traders likewise think that it will take a lot to derail the Fed from its tapering track, but steadying Treasury yields along the curve points to some risk to the timing. The question is whether there is a number that alters the Fed’s view on tapering its bond purchases in November, and what a really weak or hot number means amid the backdrop of rising stagflation fears. If U.S. treasuries find further buyers this week into Friday’s U.S. non-farm payrolls, the dollar may go on sale this week.

Elsewhere, Biden and Yellen must also decide whether to hand a second term to Federal Reserve Chairman Jerome H. Powell, a decision which could also roil markets. For Powell and his international counterparts, the combination of slowing growth and stubborn inflation is a challenge. For now, Powell and European Central Bank President Christine Lagarde are voicing cautious optimism that inflation will ease. But economists are asking at what point transitory becomes more persistent. It’s worth noting that the hopes of US stimulus, as backed by President Joe Biden and House Speaker Nancy Pelosi joins expectations that Beijing will limit the negative fallout of the Evergrande’s default to challenge the market pessimism.

It should be observed that Friday’s upbeat Eurozone PMIs and Inflation figures joined month-start consolidation to help the EUR/USD recover from the yearly low. Besides Evergrande a Friday CNBC report which said U.S. Trade Representative Katherine Tai will announce on Monday that China is not complying with U.S.-China trade rules also provided support to the dollar, especially against the yuan. Chinese markets were closed for a holiday. Oil markets will be tracking a meeting of OPEC and non-OPEC ministers too. Unemployment figures from Spain are due out in the early part of the European session.

EUR/USD 4 Hour Chart:

Support: 1.1570 (S1), 1.1544 (S2), 1.1525 (S3).

Resistance: 1.1614 (R1), 1.1633 (R2), 1.1659 (R3).

Amidst this above catalysts the euro is on uptrend against greenback. We expect bullish trend for EUR/USD.