BTC/USD Weekly Forecast (04th October 2021 – 08th October 2021)

Fundamental view:

Bitcoin showed a uptrend against the greenback in this week. It cannot be forgotten that Bitcoin price took a massive hit on September 20 as the news of China banning cryptocurrencies spread like wildfire. The People’s Bank of China (PBOC) posted a circular that tightened the noose around mining and cracked down on the mining gray areas. The recent development is not the first time China has banned Bitcoin and other cryptocurrencies. In fact, there have been roughly 12 bans from the country over the past decade.

On the other hand, Unlike China, US seems to favor crypto market. Fed chair Jerome Powell was asked if he intended to ban or limit the use of cryptocurrencies, to which he replied that he had no intention of banning them. Chair Powell did say that it would be appropriate if stablecoins were regulated, comparing them to money market funds and bank deposits. Elsewhere Tesla CEO Elon Musk stated that the cryptocurrency space must be left alone during a recent interview. He also added,It is not possible to, “I think, destroy crypto, but it is possible for governments to slow down its advancement”. El Salvador, the country that made BTC legal tender, is making progress on this front. President Nayib Bukele has teased Bitcoin mining using volcanic geothermal energy. Amidst all this catalysts, Bitcoin sees an uptrend in this week.

The major economic events deciding the movement of the pair in the next week are OPEC Meeting at Oct 01, ISM Non-Manufacturing PMI at Oct 05, ADP Nonfarm Employment Change, EIA Crude Oil Stocks Change at Oct 06, Initial Jobless Claims at Oct 07 and Nonfarm Payrolls at Oct 08 for US.

BTC/USD Weekly outlook:

Technical View:

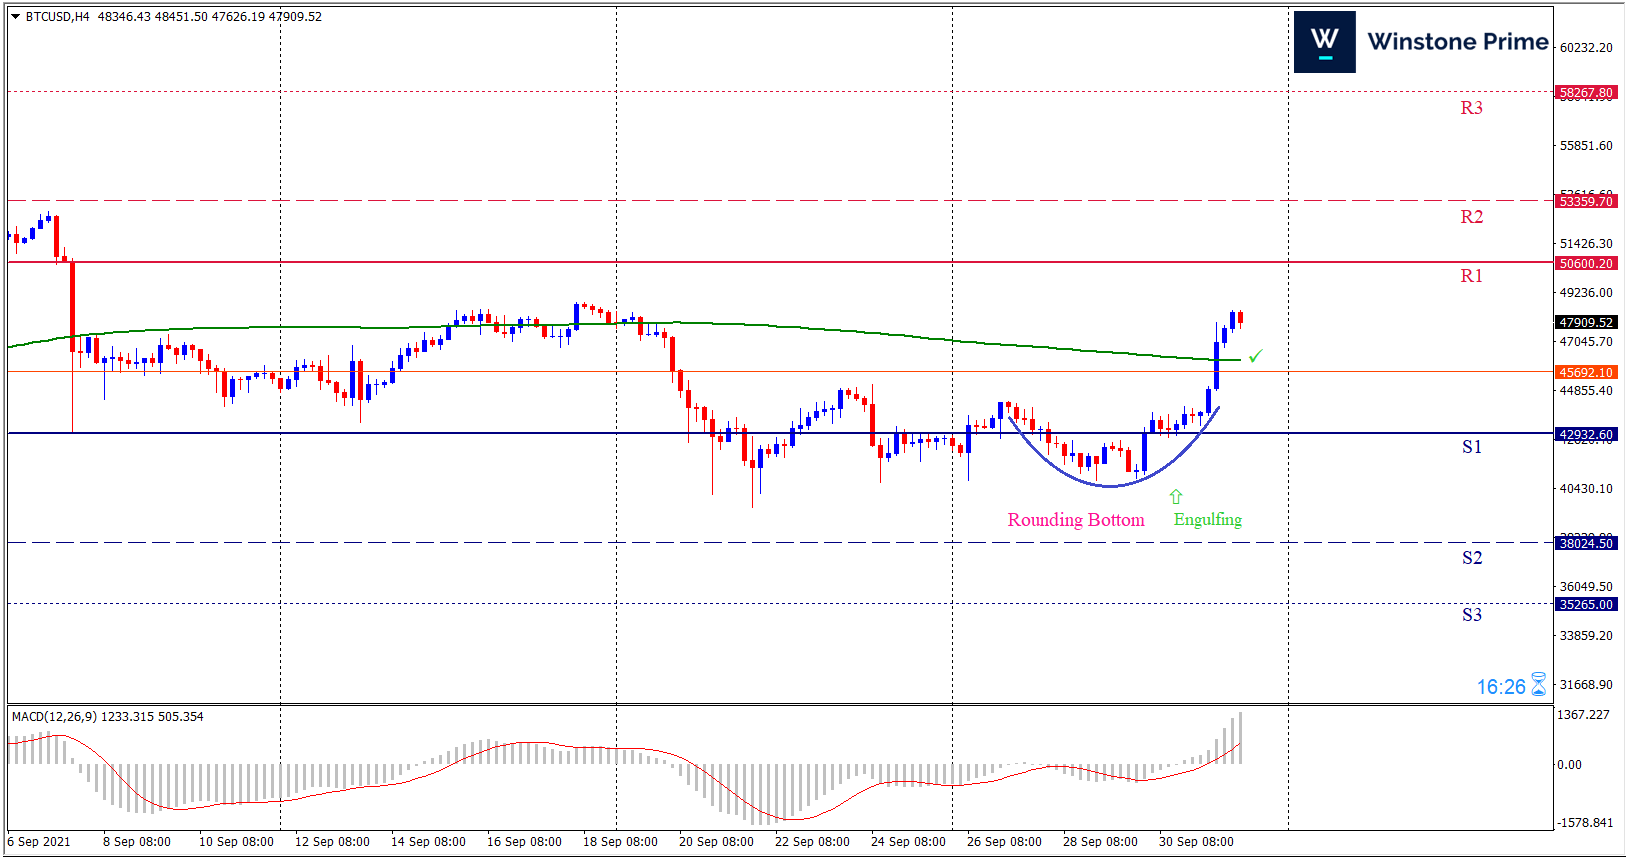
Last week’s high was 1.77% higher than the previous week. Maintaining high at 48451.5 and low at 40783.9 showed a movement of 7668 pips.

In the upcoming week we expect BTC/USD to show a bullish trend. The Instrument is trading above the 200 Simple Moving Average and the MACD trades to the upside. A firm breakout above 50600.2 may open a clean path towards 53359.7 and may take a way up to 58267.8. Should 42932.6 prove to be unreliable support, the BTCUSD may sink downwards 38024.5 and 35265.0 respectively. In H4 chart rounding bottom pattern favors prospects of a bullish trend. Bullish engulfing pattern constructs a bullish outlook for the pair in the upcoming week.

Preference
Buy: 47700.2 target at 52670.6 and stop loss at 45688.3


Alternate Scenario
Sell: 45688.3 target at 40736.9 and stop loss at 47700.2

XAU/USD Weekly Forecast (04th October 2021 – 08th October 2021)

Fundamental view:

Gold had showed a uptrend against the greenback in this week eventhough Fed sentiment and US political drama has led the way. An intensifying global energy crisis, the China Evergrande debt issue and the Fed’s tapering fears kept investors on edge has benefited the greenback.  The several appearances by Fed Chair Jerome Powell and speeches from his colleagues intensified expectations of sooner-than-expected tapering as the market began pricing in a rate hike in 2022, supported the US dollar during the first half of the week.

On the other hand, The US political drama also started coming into play in the second half of the week which weighed on investor sentiment and helped the yellow metal to maintain its bullish momentum. US Senate Majority Leader Chuck Schumer said Thursday that lawmakers agreed to extend government funding through December 3, averting an imminent shutdown. Although, the debt ceiling in mid-October still lurks amid the political wrangling. Amidst all the catalysts playing a lead role, the yellow metal showed a uptrend.

The major economic events deciding the movement of the pair in the next week are OPEC Meeting at Oct 01, ISM Non-Manufacturing PMI at Oct 05, ADP Nonfarm Employment Change, EIA Crude Oil Stocks Change at Oct 06, Initial Jobless Claims at Oct 07 and Nonfarm Payrolls at Oct 08 for US.

XAU/USD Weekly outlook:

Technical View:

Last week’s high was 1.28% lower than the previous week. Maintaining high at 1764.3 and low at 1721.5 showed a movement of 428 pips.

In the upcoming week we expect XAU/USD to show a bullish trend.  The Instrument is trading below the 200 Simple Moving Average and the MACD trades to the upside. A solid breakout above 1775.9 may open a clean path towards 1791.5 and may take a way up to 1818.7. Should 1733.1 prove to be unreliable support, the XAUUSD may sink downwards 1705.9 and 1690.4 respectively. In H4 chart falling wedge breakout favors prospects of a bullish trend. Also to be noted Hammer formation further exerts the expectation of uptrend for the pair.

Preference
Buy: 1760.3 target at 1790.5 and stop loss at 1743.7


Alternate Scenario
Sell: 1743.7 target at 1706.9 and stop loss at 1760.3

AUD/USD Weekly Forecast (04th October 2021 – 08th October 2021)

Fundamental view:

Aussie has bounced back and forth and closed the week forming a neutral candle. Demand for the American currency and plummeting equities has undermined the aussie whereas a nice comeback in gold prices partially offset their effects. Fed Chair Powell speech favored the greenback. The head of the Fed referred to stubbornly high inflation likely to extend into 2022, although he insisted it would likely be temporary. He commented that “the current inflation spike is really a consequence of supply constraints meeting solid demand, and that is all associated with the reopening of the economy, which is a process that will have a beginning, a middle and an end.” On the other hand, The Reserve Bank of Australia will have a monetary policy meeting on Tuesday, October 5. The central bank is widely anticipated to maintain the status quo, with action not expected until February 2022. 

Australia RBA Private Sector Credit monthly report on 30th Sep and US ISM Manufacturing Employment on 1st Oct created bullish trend whereas US Goods Trade Balance on 28th Sep and US EIA Cushing Crude Oil Stocks Change on 29th Sep created bearish trend for the pair.

The major economic events deciding the movement of the pair in the next week are Australia Commonwealth Bank Services PMI, OPEC Meeting at Oct 01, RBA Interest Rate Decision, US ISM Non-Manufacturing PMI at Oct 05, US ADP Nonfarm Employment Change, US EIA Crude Oil Stocks Change at Oct 06, US Initial Jobless Claims at Oct 07 and US Nonfarm Payrolls at Oct 08.

AUD/USD Weekly outlook:

Technical View:

Last week’s high was 0.10% lower than the previous week. Maintaining high at 0.7310 and low at 0.7169 showed a movement of 141 pips.

In the upcoming week we expect AUD/USD to show a bearish trend.  The currency pair is trading below the 200 Simple Moving Average and the MACD trades to the downside. A firm breakout below 0.7181 may create a fall towards 0.7105 and may take a way down to 0.7040. Should 0.7322 prove to be unreliable resistance, the AUDUSD may raise upwards 0.7387 and 0.7463 respectively. In H4 chart bearish crab pattern favors prospects of a bearish trend. And the shooting star formation provides a support on the expectation of downtrend for the pair.

Preference
Sell: 0.7245 target at 0.7111 and stop loss at 0.7327


Alternate Scenario
Buy: 0.7327 target at 0.7462 and stop loss at 0.7245

USD/JPY Weekly Forecast (04th October 2021 – 08th October 2021)

Fundamental view:

The US dollar has rallied  significantly against the Japanese yen during the course of the trading week. Surging US Treasury yields has helped the USD/JPY to reach  a level of 112, the first time high since the pandemic. Federal Reserve Chair Jerome Powell has noted in his comments after the FOMC that a majority of members felt that the economic conditions for beginning a taper of the $120 billion in monthly bond purchases had been met. Treasury yields have been in sharp ascent since then. Another concern which has temporarily supported the safe-haven dollar was the fear that the US would default on its debt.

US S&P/CS HPI Composite-20 n.s.a. monthly report on 28th Sep and US EIA Natural Gas Storage Change on 30th Sep created bearish trend whereas Japan Coincident Index on 27th Sep and US Pending Home Sales monthly report on 29th Sep created bullish trend for the pair in this week.

The major economic events deciding the movement of the pair in the next week are OPEC Meeting at Oct 01, Markit Services PMI, US ISM Non-Manufacturing PMI at Oct 05, US ADP Nonfarm Employment Change, US EIA Crude Oil Stocks Change at Oct 06, US Initial Jobless Claims at Oct 07, Economy Watchers Index for Current Conditions and US Nonfarm Payrolls at Oct 08.

USD/JPY Weekly outlook:

Technical View:

Last week’s high was 1.16% higher than the previous week. Maintaining high at 112.07 and low at 110.53 showed a movement of 154 pips.

In the upcoming week we expect USD/JPY to show a bullish trend. The currency pair is trading above the 200 Simple Moving Average and the MACD trades to the upside. A solid breakout above 111.91 may open a clean path towards 112.76 and may take a way up to 113.45. Should 110.37 prove to be unreliable support, the USDJPY may sink downwards 109.68 and 108.83 respectively. In H4 chart, Formation of falling wedge pattern indicates reversal of the trend raises prospects of a bullish trend And  three outside down pattern formation further braces our expectation.

Preference
Buy: 111.17 target at 112.69 and stop loss at 110.32


Alternate Scenario
Sell: 110.32 target at 109.21 and stop loss at 111.17