Evergrande crisis impacts Aussie

Aussie pair has eased from the daily high as investors reconsider the risks associated with the Evergrande repayment announced on Thursday. The Aussie pair are consolidating their losses of the previous four days after China’s headlines provoked a dangerous mood. China accounts for more than 35 percent of Australian exports. This bias is serious. Although the People’s Bank of China (BPOC) has left a monetary rate of close to 3.85%, the excess injection of about 110 billion Chinese yuan indicates the ability of the dragon to avoid liquidity. Earlier, Gita Gopinath, chief economist at the International Monetary Fund (IMF), was optimistic about China’s ability to curb fears emanating from real estate.

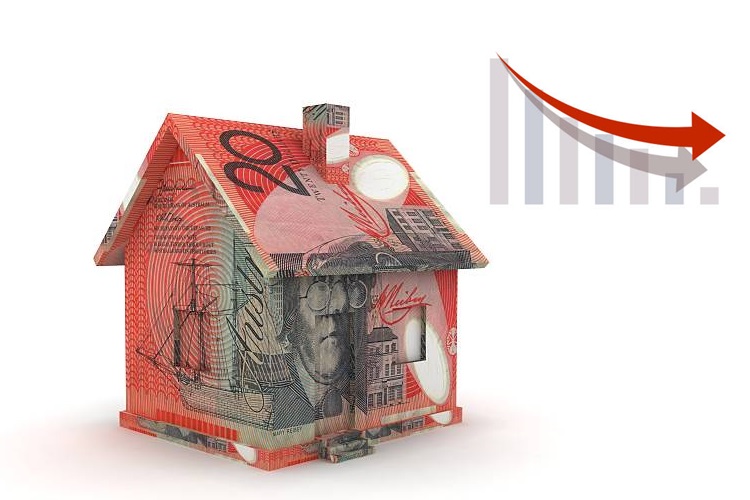
Australia’s booming housing market is leading to a buildup of consumer debt that could become a risk to financial stability, a top central banker cautioned on Wednesday, while also noting the strength was positive for the economy overall. In a speech on housing, Reserve Bank of Australia (RBA) Assistant Governor Michelle Bullock said regulators were closely watching bank lending standards and household debt as credit growth outpaced growth in incomes.

“A high level of debt could pose risks to the economy in the event of a shock to household incomes or a sharp decline in housing prices,” said Bullock, who heads the RBA’s financial system division. “The strength in the housing market is positive for the economy, and indeed an important channel for monetary policy to support the economy through housing construction, home improvements and purchases of household items,” said Bullock.

The property market has been running hot this year amid record low interest rates and strong demand for suitable work-from-home housing. Data from property consultant CoreLogic showed home prices were up more than 18% in August on a year before, the fastest pace since mid-1989. The national statistician estimated the total value of Australia’s 10.7 million dwellings rose a record A$596 billion ($430.96 billion) in the June quarter, to A$8.9 trillion. The surge has been a windfall to wealth for those that own their homes, but has also pushed housing out of the reach of many first time buyers and fed concerns about affordability.

At the same time the pair extended its decline following a September minute meeting of the Reserve Bank of Australia (RBA). The central bank said the eruption of the delta variance had diverted the economic recovery beyond what had been estimated in the previous month. RBA Governor Philip Lowe underestimated high interest rate expectations before 2024. In addition, New South Wales on Tuesday recorded 1,022 new cases and a re-emergence of the corona virus infection in Victoria. Meanwhile, construction sites in Melbourne were closed for two weeks after a violent vaccination campaign.

Aussie who have seen early market reactions to the PBOC event and Evergrande updates may be waiting for the central bank for new impetus. US topics, however, will join in the direct intermediate moves in the Covid updates and geopolitical talks on Beijing as UK Prime Minister Johnson visits the White House.

AUD/USD 4 Hour Chart:

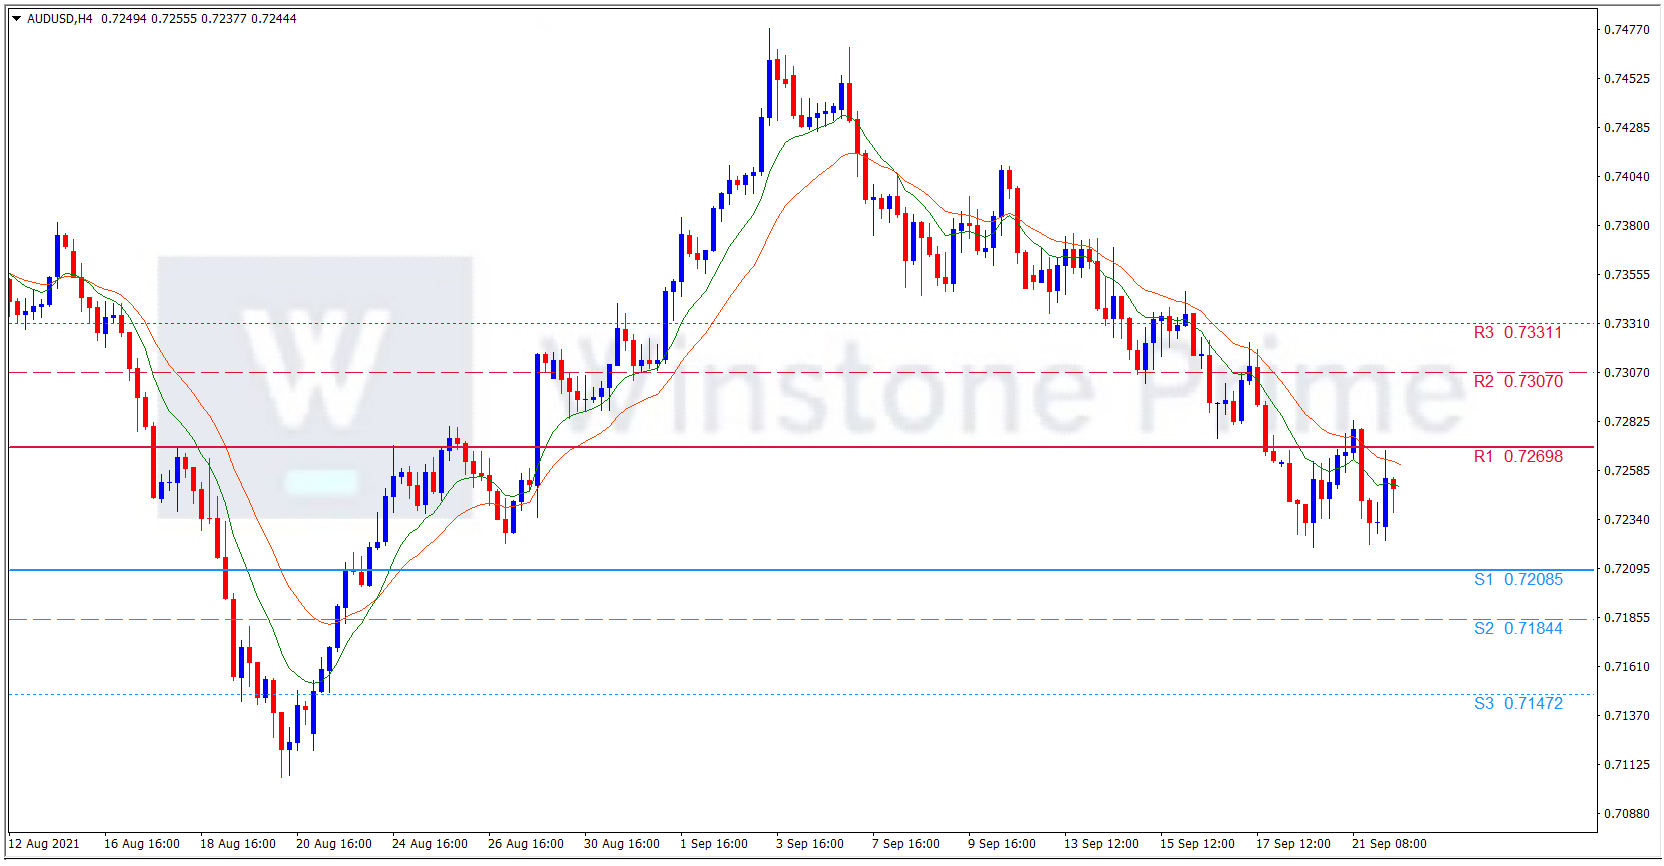
Support: 0.7209 (S1), 0.7184 (S2), 0.7147 (S3).

Resistance: 0.7270 (R1), 0.7307 (R2), 0.7331 (R3).

Evergrande updates has squeezed the Aussie pair to the downside. We expect a bearish trend for AUD/USD.

Worries keep the pound trading low

The cable pair has been dropped from yesterday itself among the strong US data on mildly upbeat market sentiment. Favoring the consolidation could be the light calendar and mixed concerns over the Federal Reserve’s (Fed) action on Wednesday. PM Boris Johnson wants a wider trade deal with the US and also better access to the country for vaccinated travellers.

The US House Speaker Nancy Pelosi said on Tuesday that she hopes for a $3.5 trillion spending bill but is prepared for any adjustments. The House and Senate are already in agreement on most of the bills. The President and Senate Democrats sent us a budget resolution with a cap of $3.5 trillion.  “I have promised Members that we would not have House Members vote for a bill with a higher topline than would be passed by the Senate.  Hopefully, that will be at the $3.5 trillion number.  We must be prepared for adjustments according to the Byrd rule and an agreed to number. This week, we must take decisive action on proceeding with the Build Back Better reconciliation legislation.” With Nancy compromising speech has impressed the greenback.

UK Prime Minister Boris Johnson urged leaders of the world’s major economies including the United States to deliver on their commitments toward a US$100 billion per year climate fund with less than six weeks to go before a UN climate summit. Johnson and UN Secretary-General António Guterres hosted a roundtable of world leaders on Monday to address major gaps on emissions targets and climate finance.  Johnson told reporters that he is hopeful that the United States can deliver on a promise to step up its share of money toward the US$100 billion annual goal but “we’ve been here before” and “we’re not counting our chickens.”

On the other hand a speech is that ‘New winter of discontent could be hard to avoid’. Boris Johnson recently announced a “plan B” with more restrictions, nothing was ruled out and masks and remote working were mentioned as possibilities. This potentially means more economic disruption. A number of other economic problems have emerged during the recovery.  Brexit has made the whole situation worse because a lot of workers in the food supply chain came from the continent and are no longer allowed to work in the UK.

The government’s idea that British workers will rush to fill the gap is misplaced there are certain problems with low-paid jobs with long and irregular hours. Lots of pubs and restaurants are struggling to stay open either because they can’t find enough workers or because of supply shortages. The price and wage increases are producing higher inflation data. Whether this is temporary depends on people’s expectations. If people begin to expect more rises, like they did in the 1970s, it will change their behavior. Firms will raise prices and more workers will want higher wages, causing an inflation spiral.

To keep the economy buoyant in recent years, the Bank of England has cut interest rates to record lows and put huge amounts of money into the economy in the form of quantitative easing. If it has to change direction because of higher inflation, this could have a big effect on asset prices, ranging from shares to houses, since they have all been bid up by cheap money. Higher interest rates would also have repercussions for the public finances, which Chancellor Rishi Sunak is clearly very worried about already. It would mean that future government debt becomes more expensive, which could put a further squeeze on public spending.

Given the upbeat market sentiment and the US dollar pullback, GBP/USD traders may remain hopeful ahead of UK PM Johnson’s visit to the US. Additionally, the Bank of England (BOE) is also up for conveying the latest monetary policy decision and the Quarterly Inflation Report (QIR) on Thursday.

GBP/USD 4 Hour Chart:

Support: 1.3622 (S1), 1.3585 (S2), 1.3530 (S3).

Resistance: 1.3714 (R1), 1.3770 (R2), 1.3806 (R3).

Amidst this above catalysts US Dollar strong moment and UK worries kept the pair into downtrend. We expect a bearish trend for GBP/USD.

Last week retail sales still impacts dollar

The dollar climbed to three-week peaks on Friday, still benefiting from better-than-expected U.S. retail sales data released on Thursday. The US dollar index (DXY) has peaked since August 23, rising last week as market sentiment soured. The US Federal Reserve (FED)’s tapping into this week’s Federal Open Market Committee (FOMC) may highlight the Covid – 19 fears and buzz as the main catalyst behind the moves. In addition, rising tensions between China and Western allies the United States, Australia and the United Kingdom also weigh on market sentiment and support the US dollar.

On the other hand the business community firmly believes that Europe must look to the future, even as they still manage the impact of the last 18 months. The European Commission’s renewed commitment to the political  priorities set out before the pandemic for the 2019-2024 legislative term remain more relevant than ever and must be pursued resolutely, while factoring in the legacy of the deep economic crisis and the need to revive the European economy. The Malta Chamber, Eurochambres and many chambers across the EU made the case to public authorities and EU institutions for effective policies and to roll out funding support to aid millions of companies, without which they could not have survived. As we move beyond the crisis, it will be crucial to pursue the other important priorities that will contribute to a swift revival of the European economy.

It’s worth noting that the European Central Bank (ECB) policymakers seem divided over the future tapering of the bond purchases and rate hike, per their latest speech. The Fed, the European Central Bank and their peers in Japan, Britain and elsewhere brought down interest rates and unleashed huge asset-buying programmes last year to prevent an economic catastrophe. The Fed, which begins a two-day policy meeting on Tuesday, slashed rates to zero at the start of the pandemic in March 2020. To provide liquidity to the world’s biggest economy, it is buying at least $80 billion a month in Treasury debt and at least $40 billion in agency mortgage-backed securities.

The ECB has a 1.85-trillion-euro pandemic emergency purchase programme (PEPP), allowing the bank to buy assets in financial markets such as bonds, making their prices rise and interest fall. The ECB has kept the rate on its main refinancing operations at zero. Fed, ECB and BoE officials have insisted that inflation is only temporary and a consequence of prices recovering from drops at the height of the pandemic last year.

When Vice President Luis de Guindos suggested challenges to higher inflation and easy money, Governing Council member Gabriel Makhlouf said on Friday that the ECB would end the easing plan before raising interest rates, but declined to comment on the timing. In addition, board member Martins Kazak told Reuters, “(he) did not reach the 2% price target in the medium term.”

The greenback is benefiting from a risk-off mood and the German Producer Price Index (PPI) for August is disappointing with softer figures than expected at 0.8% and 1.9%. The reason may be linked to the Fed’s concern and uncertainty over US stimulus. Increasing confidence in the U.S. stimulus and expanding U.S. credit limits should not forget the slow but gradual economic recovery, brightening the central bank’s contradictions and favoring the pair bears.

EUR/USD 4 Hour Chart:

Support: 1.1703 (S1), 1.1681 (S2), 1.1638 (S3).

Resistance: 1.1767 (R1), 1.1810 (R2), 1.1832 (R3).

Amidst this above catalysts the US dollar is benefiting from the Fed tapering. We expect a bearish trend for EUR/USD.

Trading expectancy and use it in trading

Developing the trading plan is the biggest steps in successful trading journey. Your plan acts as a map that covers all of the reasons why and how you trade. This includes the evidence you’ll look for before entering a trade when you’ll exit trades, risk-management precautions you’ll take, such as how much money you’re willing to risk on each trade, and so on. People who are contemplating trading, or who are even trading at the moment, and who are not familiar with the concept of trading expectancy, is to make it their priority to fully understand its meaning and importance to successfully trading.

Trading expectancy is an idea that is least understood by the majority of people who are planning to and who are actually in trading. In this article we pointed the information about What is trading expectancy and How you can use it in trading?

Trading Expectancy

The expectancy in trading is that on average, we can expect to see how much money we can make or lose for every dollar we risk. Trading expectancy is a calculation that gives what the profit is for each trade – how many trades are won with the average loss in the lost trade and the average gain in the winning trade. The key question is whether traders have an average positive effect when dividing total profits by total trades.

Over 90% of traders are trading with a negative expectancy. They are deceived into thinking that they are going to turn it around or make a run, but the truth is that they are trading a method with a negative expectancy and even if they do go on a lucky run, the end result (long term) will be unprofitable. The good news is that expectancy can be manipulated and even reversed, you just have to change certain things about the way you trade and, as a result, your expectancy can begin to recover.

Expectancy is one of the most important aspects of any trading strategy and it can be positive or negative, known as positive expectancy or negative expectancy, respectively. When experimenting with the ‘expectancy formula’, traders quickly come to realize that no single set of numbers gives a positive expectancy, but there are an infinite number of sets therefore (in theory) there exists an infinite number of trading systems that could be profitable. The expectancy model is suggesting that even random systems can be profitable if the money management is sound. The expectancy model can also impact on another trading belief; it is possible to develop systems using expectancy and position size as the underpinning foundations where the stop loss is larger than the profit target.

Now let’s see how to calculate business expectancy and expectancy ratio.

A trading expectancy is an average amount you can expect to win (or lose) per trade with your system when a large number of trades are taken (at least 30 to be statistically significant). In order to calculate expectancy, you need 4 things – your win percentage, your average win, your average loss, and your loss percentage. The expectancy formula as follows.

Here’s how to calculate trade expectancy, then we’ll look at some scenarios.

(Win % x Average Win Size) – (Loss % x Average Loss Size)

Input the percentages as a decimal. For example, 80% is 0.8.

Consider Richard Dennis and the Turtles. Their system often won less than 30% of time, some of the Turtles even won less than 15% of the time, but the strategy still made them money. That’s because their wins were so much bigger than their losers. There is a big difference between winning and profiting.

Let’s assume someone using a similar strategy only wins 20% of the time, but they make $1000 when they win and they lose $100 when they lose.

(0.2 x $1000) – (0.8 x $100) = $200 – $80 = $120

The number is positive, which shows the strategy has a positive expectancy. It is making money. But what does the $120 mean? The expectancy is the average return for each trade, including wins and losses. This trader is expected to win 2 out of 10 trades, resulting in $2000 in gains. They are also expected to lose 8 trades out of 10, resulting in losses of $800. Subtracting the $800 dollars in losses from the $2000 gained, the trader is left with a gain of $1200 over 10 trades. How much did they make on average per trade? $1200 divided by 10 is $120. Therefore, trading expectancy is what we expect to make on each trade, based on our win rate and average gains and losses.

A classic trader mistake is to take small profits hoping to win all the time, but then letting the losing trades get out of hand. Consider a trader who wins 70% of the time, making $150 on average when they win but losing $400 on losing trades.

(0.7 x $150) – (0.3 x $400) = $105 – $120 = -$15

For every trade this trader places they can expect, on average, that $15 will drain from their account. Over 10 trades they can expect to lose $150. With a negative expectancy, the more trades taken the more money that is lost. This trader may win often, but they aren’t profitable.

How can this trader become more profitable? Probably the easiest fix is to try to reduce the size of the losses, potentially with a stop loss order. If this trader can reduce losses to say $200, they will be profitable, even though the wins are only $150. This is because this trader is winning more than they are losing.

(0.7 x $150) – (0.3 x $200) = $105 – $60= $45

By reducing the size of losses, this trader can now expect to make $45, on average, every time they make a trade.

The trader could also refine their method so they are making more on winning trades. This could also swing the strategy into profitable territory. Since the win rate is already quite high at 70%, it will be hard to improve on that. Therefore, effort is best spent on reducing the size of losses or increasing the size of winners.

If your win rate is below 50%, your wins must be larger than your losses in order to produce an overall profit. The lower the win rate, the larger those wins need to be relative to the losses.

If your win rate is above 50%, your wins can be bigger or smaller than your losses. Bigger wins than losses is ideal. The higher the win rate, the larger the losses can be relative to the win size.

In all cases, risk must be controlled. Ideally, keep risk to less than 2% of trading capital.

Over expectancy in trading

Trade expectancy really matters when there is many trades. While 10 trades were used in the examples above to keep it simple, 10 trades means nothing. It is a statistical blip. To get a reasonably trade expectancy, look at results over 50 trades, or preferably 100 or more. Over that many trades we start to get a truer sense of how a strategy performs. Over time, things change. Market conditions change and we change. That means that our trade expectancy may change over time. That is okay. Changes in our trade expectancy gives us important information we can use to keep our trading on track.

If we were profitable, but are becoming less so, market conditions may have changed or maybe we have become sloppy in implementing the strategy. In either case, we need to correct our behavior, adjust our strategy, or simply step away from the market until conditions become more favorable. If our trade expectancy is improving, consider why. Did you change something? Inquiring may produce insights that continue to propel you forward.

Money Management and Risk

You have to take a risk if you want to trade and apply money management. Your return would be exact of what you take the risk.  After understanding the expectancy rates the next big decision you should be taking is position sizing. That’s the reason why some investors are happy with their ten or fifteen percent a year returns, while some traders prefer making millions from their twenty to thirty thousand. In the end, you should trade as per your preferences and choose the position of your trade as per the risk you are willing to take.

Conclusion

Nevertheless, expectancy is a good benchmark to evaluate a trading strategy. You could also think of expectancy as how much you can theoretically expect to get paid for each trade you take over time.

As we all know, it’s impossible to always be right when trading forex. However, figuring out your expectancy helps shift focus away from being right per trade to instead how right you are overall.