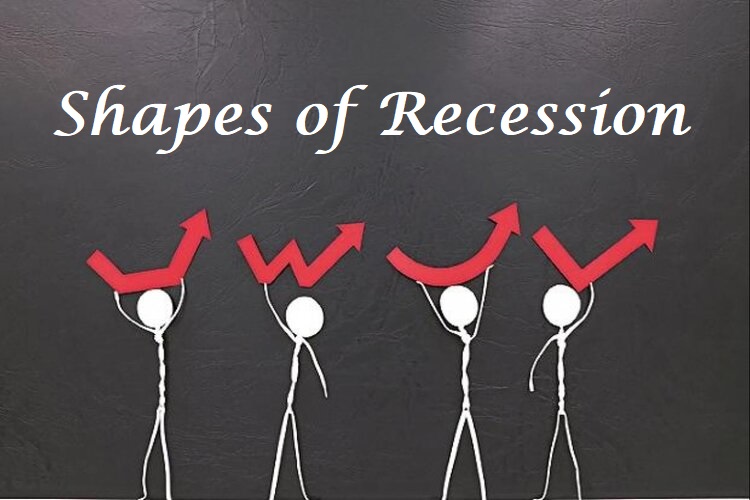
Since last year economists have mostly used the alphabets to define economic recovery and we often hear it. Many economic commentators have used alphabets and shapes to abbreviate the possible economic conditions for what might happen after a recession outbreak is controlled. They are great as visual aids, but what is the difference between them? In practice what do they say? Covid–19 recession duration is only known backwards. The past recession and recovery have followed four common patterns: V, U, W and L the letters describing the path of GDP employment and other key measures that monitor economic conditions.
We explained here about how an economy recovers from a recession, all you need to know about the different types of recovery and the comparison of it and the trading opportunities that can arise.
The NBER defines a economic recession as “a significant decline in economic activity spread across the economy, lasting more than a few months, normally visible in real GDP, real income, employment, industrial production, and wholesale-retail sales.” Recessions do not last forever and neither will a coronavirus recession. At some point, the economy will reopen and start growing again, although what the recovery might look like is unclear.
Most of the time economic cycle does not run as smoothly. One economy will have its ups and downs at each stage and one phase will last considerably longer than the other. For example, an economy will shrink and then begin to expand again without technically entering a recession. Similarly, economic recovery can follow a variety of methods. The type and speed of any economic recovery are often characterized by the characters V, U, W and L all these various recovery paths.
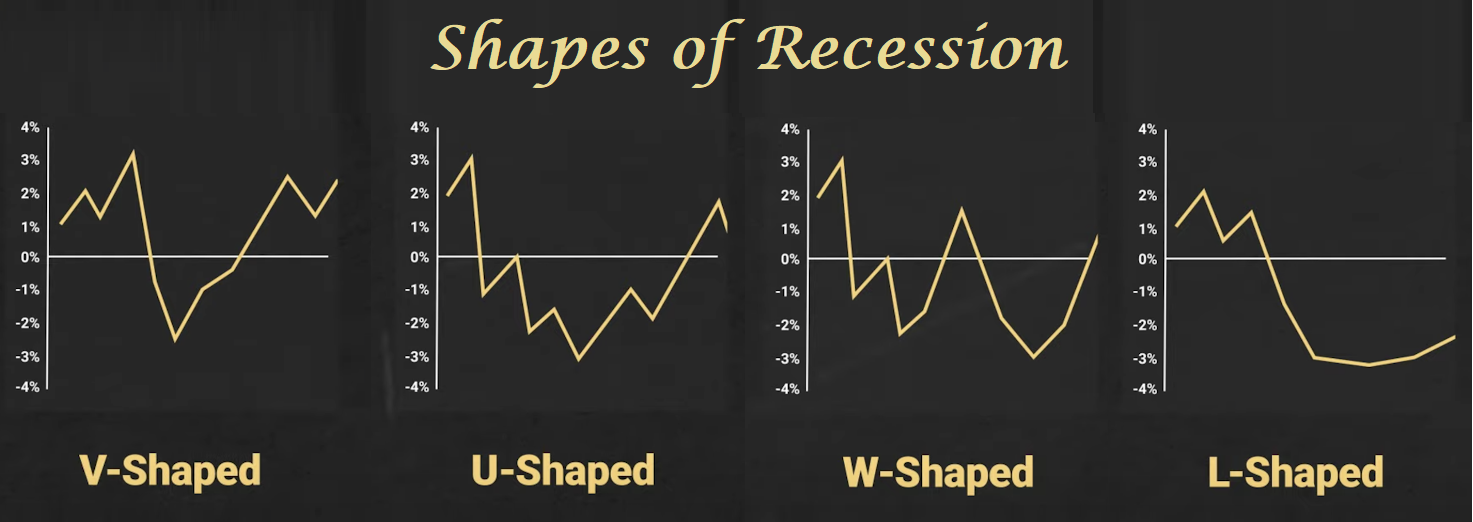
V-Shaped Recovery:
During the V-shaped recession, the economy is hit by a sharp but brief economic downturn with a clearly defined tank, followed by a strong recovery. V-forms are the natural form of a recession because the strength of the economic recovery is generally closely related to the intensity of the previous recession.
Economists developed the V-shaped recovery chart and other charts after evaluating the overall health of an economy considering growth signals such as industrial output, gross domestic product, employment level and other factors.
In the United States, the 1953 recession is an instance of a V-shaped recovery in which the economy recovered from recession through the activities of consumers such as demand and spending.
U-Shaped Recovery:

The recovery here is similar to the previous one, but the economy has been under stress for a long time, perhaps several years, before growth resumes. Naturally, long businesses will have a lasting economic impact if large countries are reluctant to reopen their economies. Hopefully, during the period when most people were almost confined to their homes, demand increased. This will help in rapid economic recovery.
The 1973-1975 economic recession in the United States was one in which the economy began to shrink notably and gradually but later began to recover gradually two years later. When there was an economic recession, the GDP reduced so as did employment rate and industrial output. Once the economy begins to recover, these factors increased as well.
W- Shaped Recovery
The W-shaped recession is called the double-dip recession. In which the economy falls into recession, recovers with short-term growth, and then falls back into recession before recovering, giving the alphabet ‘W’ and the “down up down up” pattern. Investors and traders can only be under the illusion that the economy is recovering to see another fall.
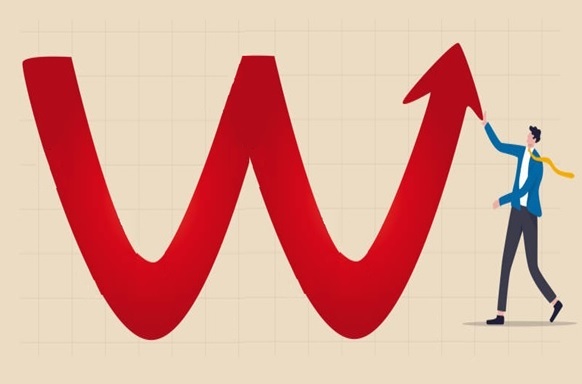
The recession in the United States in the early 1980s is an example of a W-shaped recession. The National Bureau of Economic Research considers two recessions of the early 1980s. The economy fell into recession from January 1980 to July 1980, shrinking at an annual rate of 8 percent from April to June 1980. The economy then entered a period of rapid growth, growing at an annual rate of 8.4 percent in the first three months of 1981. Federal Reserve raised interest rates against inflation, pushing the economy back into recession from July 1981 to November 1982. Hence it is called as Doulble dip recession. The economy then entered a period of strong robust growth for the rest of the decade.
L-Shaped Recovery:
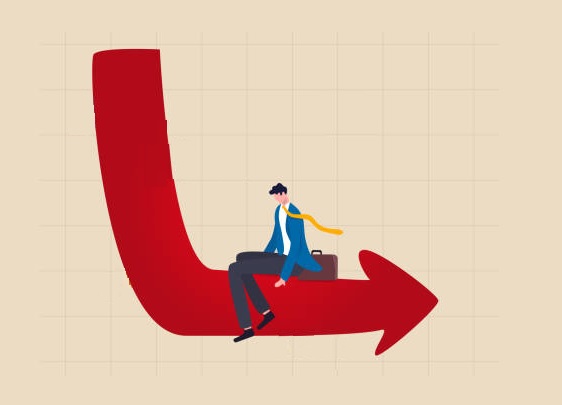
The recovery is seen as the worst and it is the dreaded scenario. If businesses are required to stay closed for a long time, even with subsidies they won’t survive. A cure or a vaccine potentially takes months, if not years to develop. Social anxiety keeps people from returning to shops and supporting the economy. The massive debt accumulated keeps the economy from growing, and inflation skyrockets. There are many ways that the economy might not recover.
The L implies that lack of growth becomes the new normal, and the economy struggles to recover after the already large drop. Some people point to the slow recovery after the 2008 crash (with the return of a crisis in 2011) as a potential outcome. In this scenario, it could take years for the economy to return to the growth level we saw just a couple of months ago.
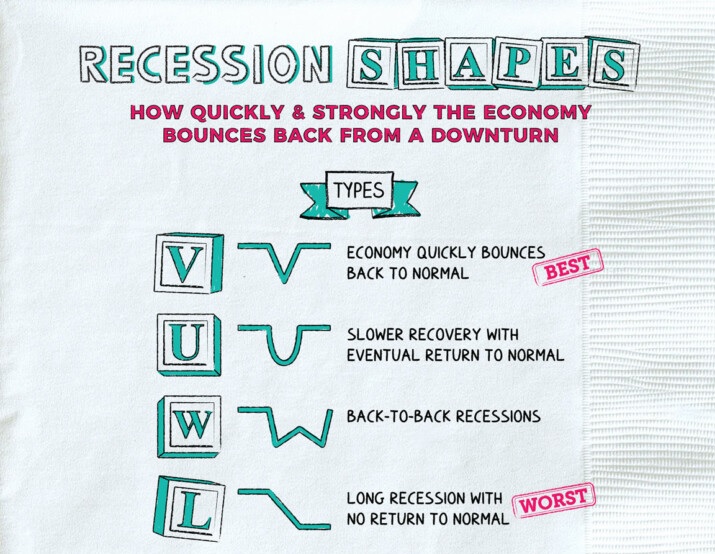
The V-shaped and U-shaped recoveries are the most common, although the other shapes are not far from unheard of. A V-shaped recovery is the best-case scenario thanks to the short period of time spent in the recession’s trough, while an L-shape is the worst-case scenario because it has the most prolonged recovery.
However, these letters only tell part of the story. While they describe the duration and nature of economic recovery, they don’t describe the severity of the recession that preceded it. For example, a recession in which GDP falls 1% and the recovery takes a U-shape might be preferable to one in which GDP falls 4% but takes a V-shape.
The Covid-19 pandemic has buffeted the world economy and induced one of the most abrupt drops in output ever recorded. What comes next? Will the economy recover quickly as lockdown measures are lifted, or will the damage inflicted by the massive waves of layoffs be more permanent? In pictorial terms, will the economic crisis be V-shaped as commentators were initially hoping for, or U-shaped or perhaps W-shaped, with a relapse due either to further lockdowns, or to premature lifting of the economic support to households and firms? The possibility of an L-shaped crisis, with a permanent loss of output, is also considered. Or else, maybe, a “swoosh”, with a rapid drop followed by an excruciatingly slow recovery?
The economic consequences that began with the further effects of the pandemic have taken the direction of modeling the dynamics of the pandemic to propose optimal lockdown policies. Others studied the impact of lock-downs on GDP growth. These studies have taken the view of balancing trade between the health of the economy and the health of the citizen. However, the evolution of the pandemic is still uncertain before vaccines become widely available, and calculations based on short-term trade can be detrimental because policymakers sometimes make the mistake of protecting the economy and securing lock-downs too quickly.
Conclusion
A recession’s shape is determined by how long it takes the economy to recover, how strong the recovery is, and whether the economy manages to avoid falling into a second recession shortly thereafter. A best-case scenario is a V-shaped recession, while a worst case is an L-shape. Basically, the longer the economy is shut down, the more likely we are to transition from a V-shape, through a U-shape, and finally end up in an L-shape scenario.
The forex market is much more complex, but an area that could be ripe for the taking. It depends on where the recession is happening, whether it is in one major nation or in a bloc of countries that, in terms of trade and finance, are heavily intertwined – like the eurozone. Currencies and commodities always trade in pairs, meaning one has to go up if another is to go down. It’s all about piecing the right conditions with the right country. For example, if there was a global recession. EUR/USD and GBP/USD are positively correlated forex pairs, with an increase or decrease in one often seeing an equal increase of decrease in the other. The reason for this correlation is the close relationship between the US dollar, the euro and the pound – with these three currencies being entwined by the strong economic ties between each of their respective economies and the price of the Canadian dollar is often positively correlated with the price of oil. All the correlation creates a opportunity to trade in case of recession. Open an account and start trading with Winstone prime.